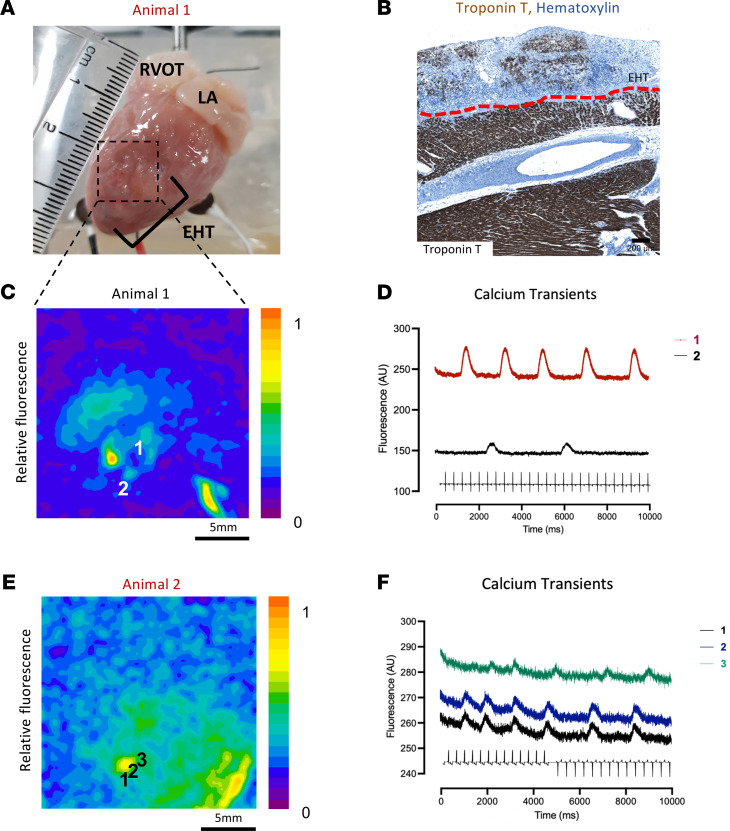
Figure 5. EHT optical mapping.
(A) Macroscopic image of EHT/rabbit heart explanted and mapping 1 week postgrafting. (B) Troponin T staining (brown area) of animal in A, host/EHT separated by red dotted line; scale bar: 200 μm. (C) Fluorescence map of animal in A; (D) calcium transients of C; numbers correspond to numbers in C. (E) Fluorescence map of animal 2 weeks postgrafting. (F) Respective calcium transients of E.

