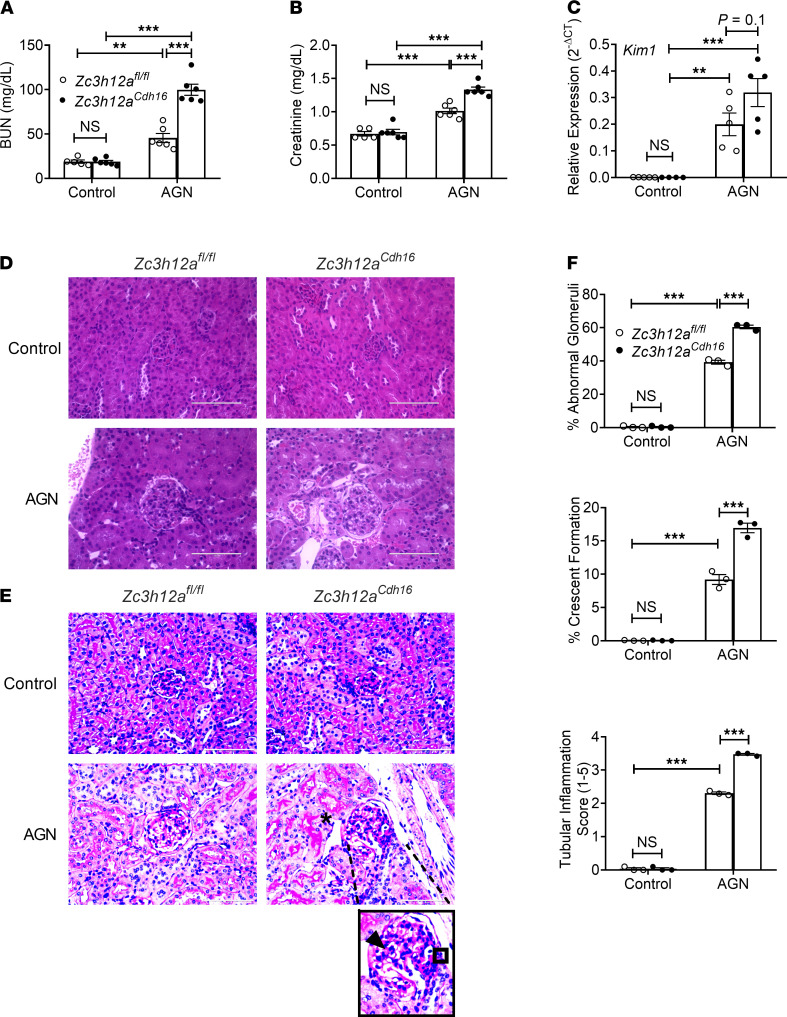
Figure 3. RTEC-specific Regnase-1 deficiency exacerbates AGN.
Zc3h12afl/fl and Zc3h12aCdh16 mice (n = 5–6) were subjected to AGN. (A and B) At day 14 p.i., serum BUN (A) and serum creatinine (B) levels were assessed. (C) Kim1 transcript expression was assessed at day 7 p.i. Expression was normalized to Gapdh. (D and E) Representative photographs of H&E-stained (D) and PAS-stained (E) renal histopathology. (F) Renal pathology was blindly evaluated and scored for percentages of abnormal glomeruli and crescent formation and for tubular inflammation. Data representative of 1 of 3 mice/group for D and E. A small part (as indicated by dotted lines) of the original image (total original magnification, ×400) was shown as inset panels. Open square, indicating entire glomerulus with mesangial and endocapillary hypercellularity; black arrow, GBM thickening; asterisk, tubular atrophy. Data pooled from at least 2 independent experiments. Statistical analysis by 2-way ANOVA. **P < 0.01; ***P < 0.001.

