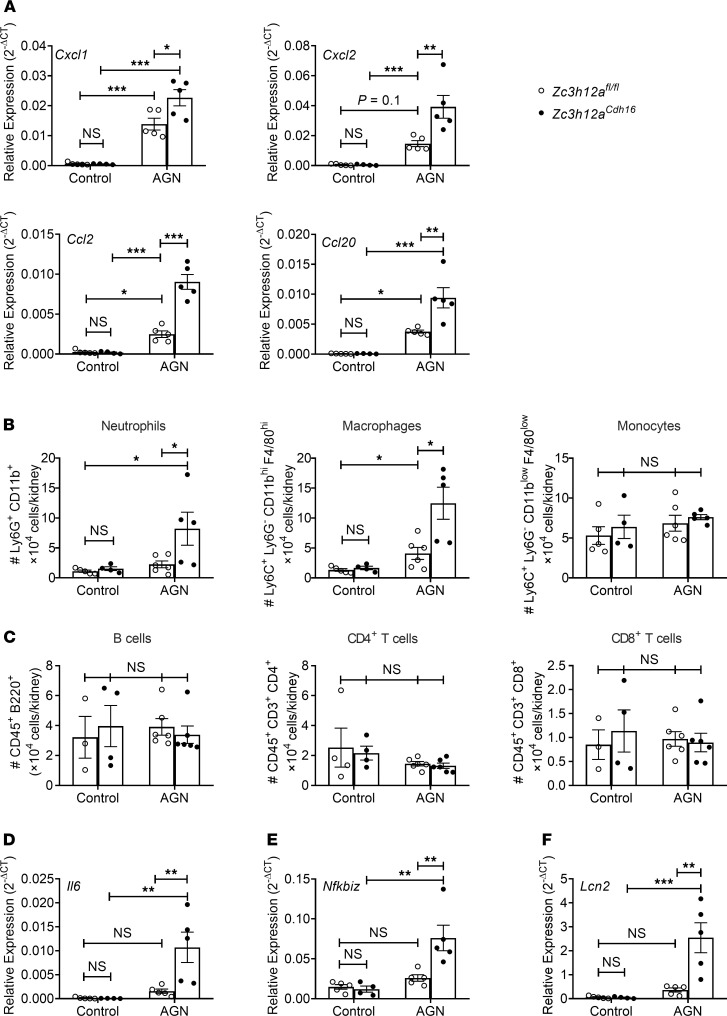
Figure 4. Increased inflammatory gene expression and cell infiltration in the nephritic kidney of RTEC-specific Regnase-1 deficient mice.
Zc3h12afl/fl and Zc3h12aCdh16 mice (n = 3–6) were subjected to AGN. (A–F) At day 7 p.i., renal Cxcl1, Cxcl2, Ccl20 and Ccl2 mRNA (A) expression was measured by qPCR; neutrophil, macrophage, monocyte, B cell, CD4+ T cell, and CD8+ T cell infiltration in the kidney was quantified by flow cytometry (B and C); and Il6 (D), Nfkbiz (E), and Lcn2 (F) transcript expression was evaluated by qPCR. Expression was normalized to Gapdh (A, D, E, and F). The data is pooled from at least 2 independent experiments. Statistical analysis by 2-way ANOVA. *P < 0.05; **P < 0.01; ***P < 0.001.

