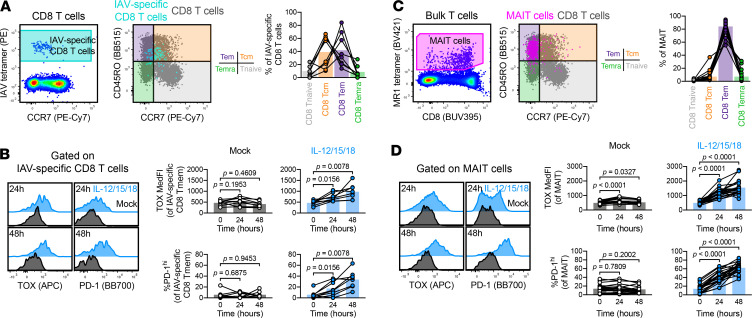
Figure 6. Stimulation induces TOX and PD-1 expression in conventional and innate-like T cells.
TOX and PD-1 induction in IAV-specific CD8+ T cells. (A) Gating and memory phenotyping of IAV-specific CD8+ T cells. (B) Induction of TOX and PD-1 in IAV- specific CD8+ T cells by mock (black) or IL-12/15/18 (each at 100 ng/mL, blue) stimulation. (C and D) TOX and PD-1 induction in MAIT cells. (C) Gating and memory phenotyping of MAIT cells. (D) Induction of TOX and PD-1 in MAIT cells by mock (black) or IL-12/15/18 (each at 100 ng/mL, blue) stimulation. Representative plots are sourced from the same donor. Symbols represent unique samples (by time point/condition/subset) and are connected by donor identity, with bars representing mean. We determined statistical significances in B and D using Wilcoxon’s matched-pairs signed-rank tests. A and B depict n = 8 donors across 2 experiments; C and D depict n = 23 donors across 4 experiments. TOX, thymocyte selection–associated high-mobility group box; PD-1, programmed cell death protein 1; IAV, influenza A virus; MAIT, mucosal associated invariant T.

