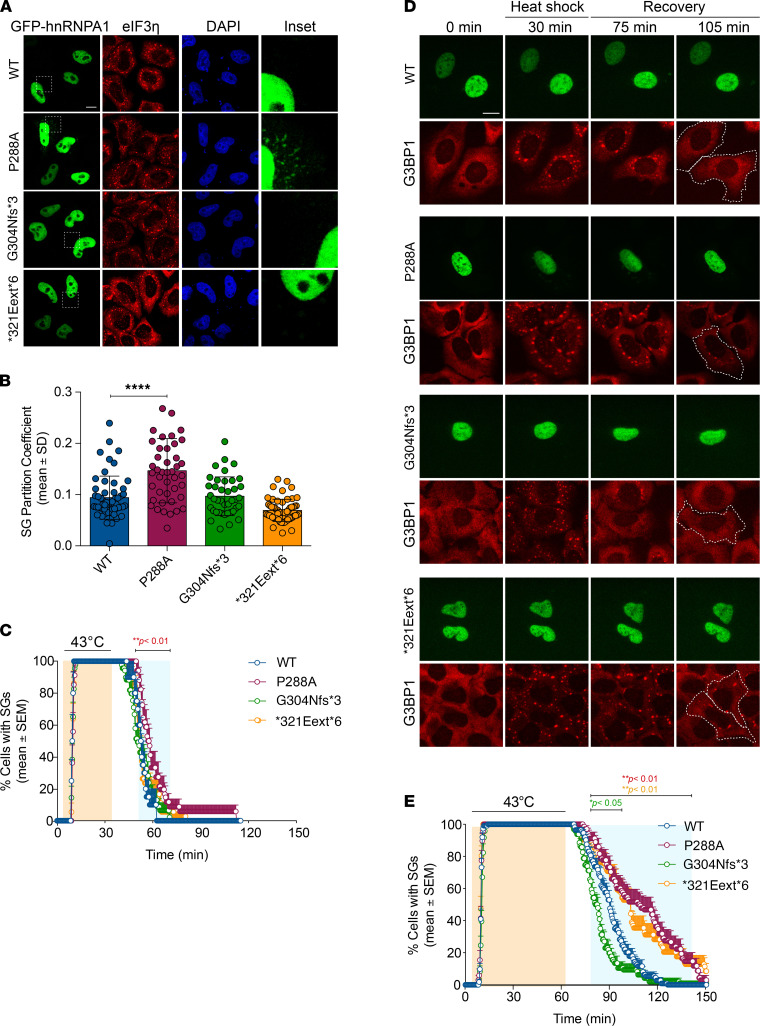
Figure 5. Localization and stress granule dynamics of the hnRNPA1 mutants.
(A and B) HeLa cells were transiently transfected with WT or mutant EGFP-tagged hnRNPA1 and subjected to arsenite stress (0.5 mM sodium arsenite, 30 minutes). Cells were fixed and stained with eIF3η (red) and DAPI (blue). Confocal images were taken for partition coefficient analysis. Scale bar: 10 μm (original magnification, ×10 for the insets). Error bars represent mean ± SD (n = 55, 43, 40, and 58 cells for WT, P288A, G304Nfs*3, and *321Eext*6, respectively). ****P < 0.0001, by ordinary 1-way ANOVA with Dunnett’s multiple comparisons test. (C) U2OS cells expressing tdTomato-tagged endogenous G3BP1 were transiently transfected with WT or mutant EGFP-tagged hnRNPA1 and subjected to heat shock (43°C, 30 minutes; orange shading) and allowed to recover at 37°C for 2 hours. Line graph represents the percentage of cells with visible tdTomato-G3BP1 puncta over time. Error bars represent mean ± SEM (n = 10, 17, 23, and 18 videos for WT, P288A, G304Nfs*3, and *321Eext*6, respectively). Blue shaded area indicates time points at which P288A mutant was statistically significantly different from WT. **P < 0.01 by 2-way ANOVA with Dunnett’s multiple comparisons test. (D and E) U2OS cells expressing tdTomato-tagged endogenous G3BP1 were transiently transfected as in C and subjected to heat shock (43°C, 60 minutes; orange shading) and allowed to recover at 37°C for 90 minutes. White dotted lines (D) delineate hnRNPA1-positive cells; scale bar indicates 10 μm. Line graph (E) represents the percentage of cells with visible tdTomato-G3BP1 puncta over time (n = 56, 34, 48, and 35 videos for WT, P288A, G304Nfs*3, and *321Eext*6, respectively). Blue shaded area indicates time points at which each mutant was statistically significantly different from WT. *P < 0.05, **P < 0.01 (colors correspond to the respective mutants), by 2-way ANOVA with Dunnett’s multiple comparisons test.

