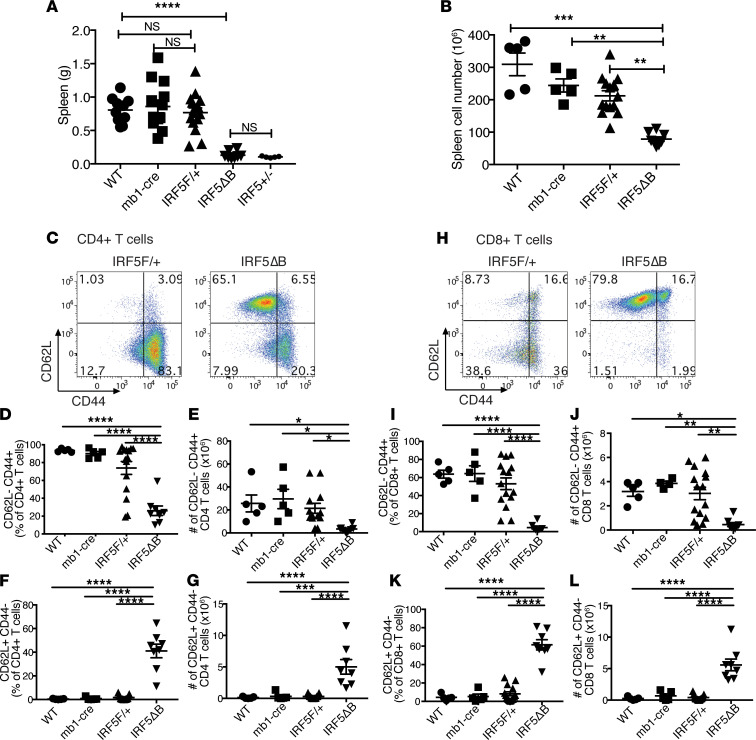
Figure 2. Splenomegaly and T cell activation are reduced in IRF5ΔB mice.
All analyses were done in 5-month-old FcγRIIB−/−Yaa mice. (A) Spleen weights from WT (n = 10), mb1cre (n = 13), IRF5F/+ (n = 16), IRF5ΔB (n = 8), and IRF5+/– (global heterozygous deletion, n = 5) mice. (B) Splenic cell counts from WT (n = 5), mb1cre (n = 5), IRF5F/+ (n = 14), and IRF5ΔB (n = 8) mice. (C) Representative flow cytometry plots of CD4+CD62L–CD44+ (effector/memory) and CD62L+CD44– (naive) T cells from spleen of IRF5F/+ and IRF5ΔB mice. (D and E) Percentage and number of CD62L–CD44+ CD4+ T cells from WT (n = 5), mb1cre (n = 5), IRF5F/+ (n = 15), and IRF5ΔB (n = 8) mice. (F and G) Percentage and number of CD62L+CD44–CD4+ T cells. (H) Representative flow cytometry plots of CD8+CD62L–CD44+ (effector/memory) and CD62L+CD44– (naive) T cells from spleen of IRF5F/+ and IRF5ΔB mice. (I and J) Percentage and number of CD62L–CD44+CD8+ T cells from WT (n = 5), mb1cre (n = 5), IRF5F/+ (n = 15), and IRF5ΔB (n = 8) mice. (K and L) Percentage and number of CD62L+CD44–CD8+ T cells. Data are shown as mean ± SEM and were analyzed using 1-way ANOVA with Tukey’s post hoc test; *P < 0.05, **P < 0.01, ***P < 0.001, ****P < 0.0001. IRF5, IFN regulatory factor 5.

