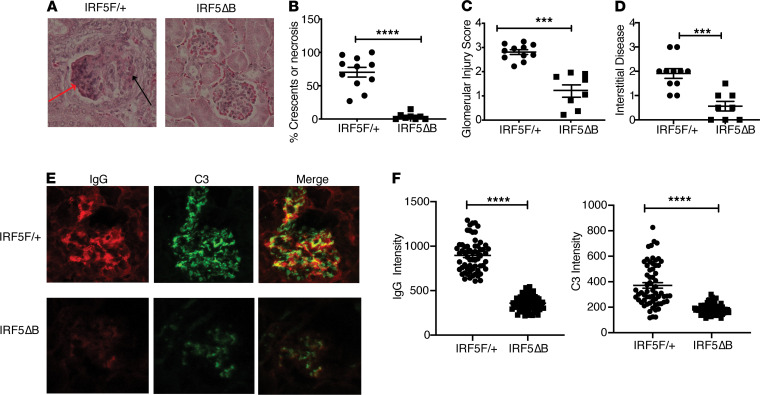
Figure 4. Decreased renal disease in IRF5ΔB mice.
All analyses were done in 5-month-old FcγRIIB−/−Yaa mice. (A) Representative renal histology of IRF5F/+ and IRF5ΔB mice. Red arrow depicts necrotic cells; black arrow depicts cellular crescent (original magnification, ×20). (B–D) Quantification of renal disease by (B) percentage of glomeruli with crescents or necrosis, (C) glomerular injury score, and (D) interstitial disease. IRF5F/+ (n = 11) and IRF5B (n = 8). (E) Representative examples and (F) quantitation of glomerular IgG and complement C3 deposition measured by fluorescence intensity in 11–14 glomeruli per mouse from 5 mice per group. All scored glomeruli are shown (original magnification, ×20). Data are shown as mean ± SEM and were analyzed using 2-tailed, unpaired Welch’s t test; ***P < 0.001, ****P < 0.0001. IRF5, IFN regulatory factor 5.

