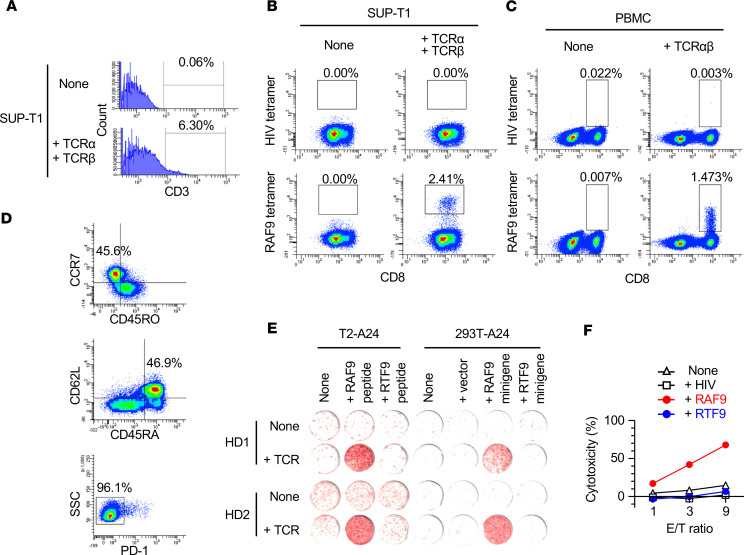
Figure 7. Isolation of RAF9-reactive TCR and transduction to peripheral blood lymphocytes.
(A and B) Flow cytometry of SUP-T1 cells transduced with retroviral vectors encoding the TCRα and -β sequences isolated from a RAF9-reactive TIL clone (1E8). The numbers (%) represent the frequency of CD3+ cells (A) or RAF9–HLA-A24 tetramer+ cells in CD8+ cells (B). (C) Flow cytometry of healthy donor 1–derived (HD1-derived) PBMCs transduced with a retroviral vector encoding concatenated RAF9-reactive TCRα and -β sequences. The numbers (%) represent the frequency of RAF9–HLA-A24 tetramer+ cells in CD8+ cells. (D) Flow cytometry of the CD8 and RAF9 tetramer–double-positive fraction of HD1-PBMCs transduced with RAF9-TCRαβ. The numbers (%) represent the frequency of cells in the indicated fraction in the whole CD8 and tetramer double-positive cells. (E) IFN-γ ELISpot assay of the transduced PBMCs in response to T2-A24 cells pulsed with 100 nM of the indicated peptides (left) or 293T-A24 cells expressing minigenes encoding RAF9 or RTF9 peptide (right). The experiments were independently performed using PBMCs from 2 individuals (HD1 and HD2). (F) LDH-release cytotoxicity of the transduced PBMCs against T2-A24 cells pulsed with the indicated peptides at the indicated effector/target (E/T) ratio. The y axis represents LDH release (%) by the target cells. Data are representative of 3 independent experiments.

