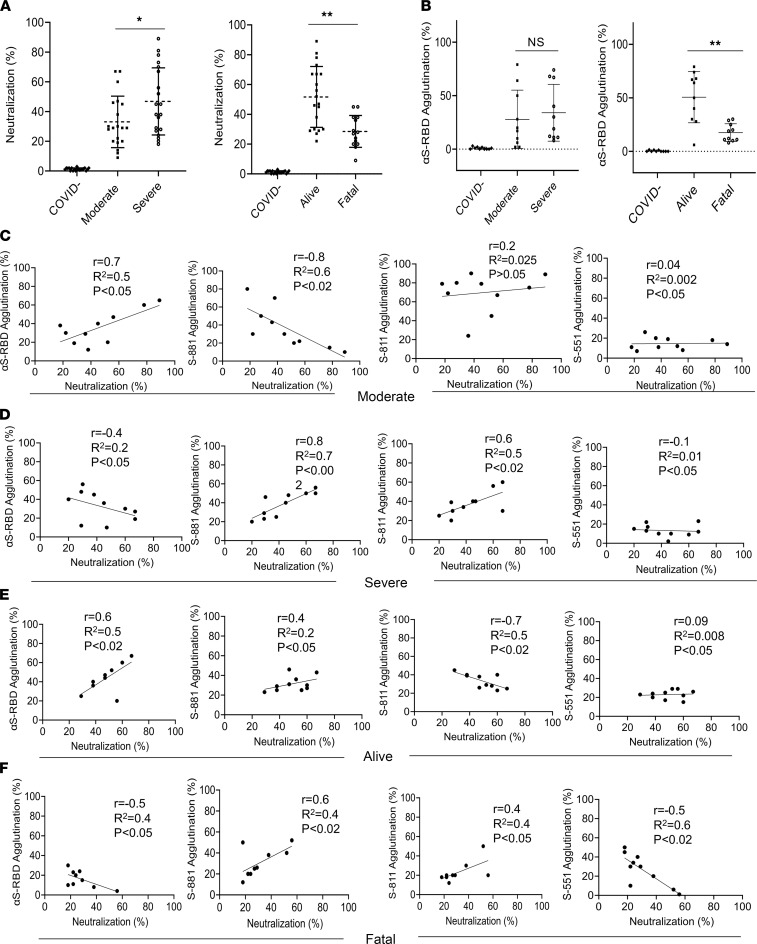
Figure 6. Antibody specificity predicts neutralization efficiency and disease outcome.
(A) Correlation of neutralization efficiency with clinical severity (left) or outcome (right). *, P < 0.05; **, P < 0.01. (B) Correlation of S-RBD antibody response measured by latex agglutination with COVID-19 severity (left) or outcome (right). **, P < 0.01. Error bars represent SD. (C–F) Pearson’s (r) correlation between epitope-dependent agglutination and neutralization. The coefficient of determination (R2) was calculated based on linear regression analysis. Confidence interval: 95%. The P values were calculated using a 2-tailed t distribution with n – 2 degrees of freedom (n = 10). P values are shown on each graph.

