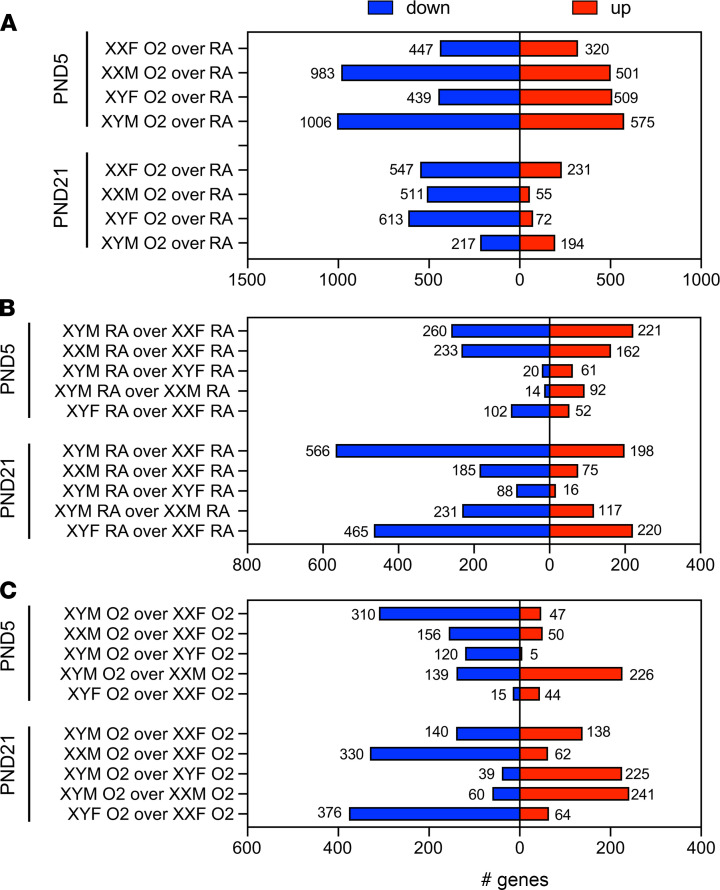
Figure 4. Transcriptomic analysis of FCG mice shows a robust and genotype-specific response to neonatal hyperoxia exposure.
The total number of up- and downregulated differentially expressed genes (DEGs). (A–C) The hyperoxia response in each genotype is shown in A, while differences between the genotypes in normoxia and under hyperoxic conditions are shown in C and B, respectively.

