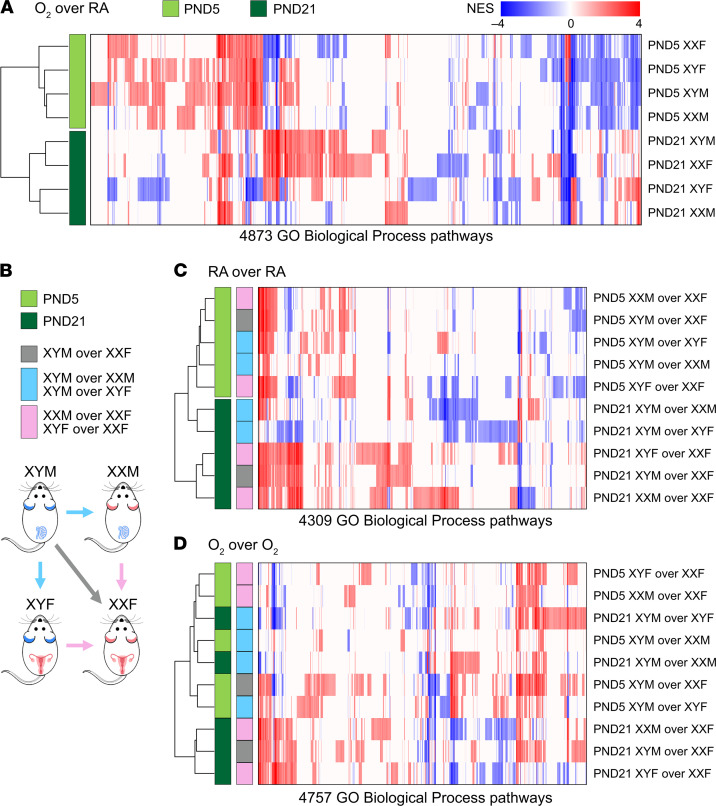
Figure 6. Pathway-based cluster analysis for transcriptomic footprints of hyperoxia exposure or of genotype differences in the FCG mouse model.
Gene Set Enrichment Analysis (GSEA) was used to quantify enrichment of GO Biological Process pathways. Hierarchical clustering and heatmaps were generated for the transcriptomic footprints using the significant normalized enrichment scores (NES). (A) Pathway-based clustering of response to hyperoxia across all genotypes show striking and distinct clustering between the P5 and P21 responses. (B) Overview of intergenotype comparisons. (C) Pathway-based clustering of intergenotype differences under room air conditions also show robust clustering with the time points. (D) Hierarchical clustering of enriched biological pathways under hyperoxia of intergenotype comparisons does not show clustering with respect to post-natal day.

