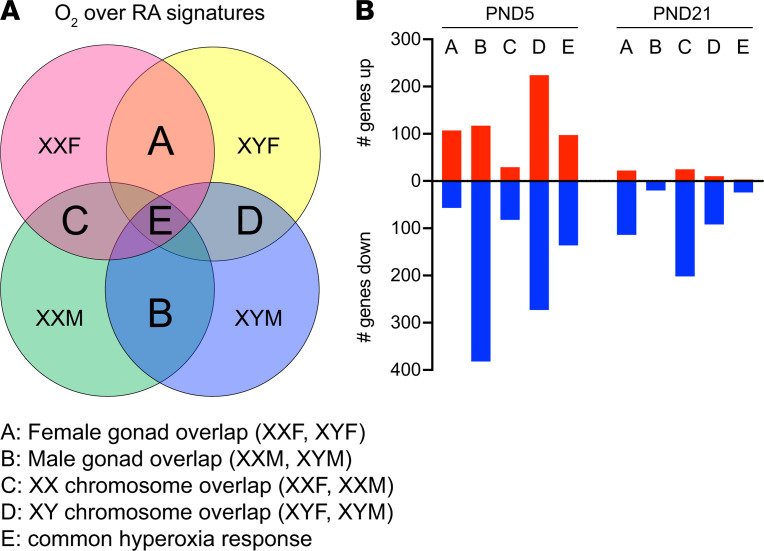
Figure 7. Distribution and overlap of gene signatures in the FCG mouse model based on the gonadal and chromosomal sex.
(A) The 4-way Venn diagram shows the schematic used to discern the number of genes (up- and downregulated) based on female gonadal response (area A; common genes between XXF and XYF), male gonadal response (area B; common genes between XXM and XYM), female chromosomal response (area C; common genes between XXF and XXM), and male chromosomal response (area D; common genes between XYF and XYM). Area E (which represents the common differentially expressed genes [DEGs] across all the genotypes) was not included for the groups above. (B) The adjoining graph provides the number of genes from each of these groups.

