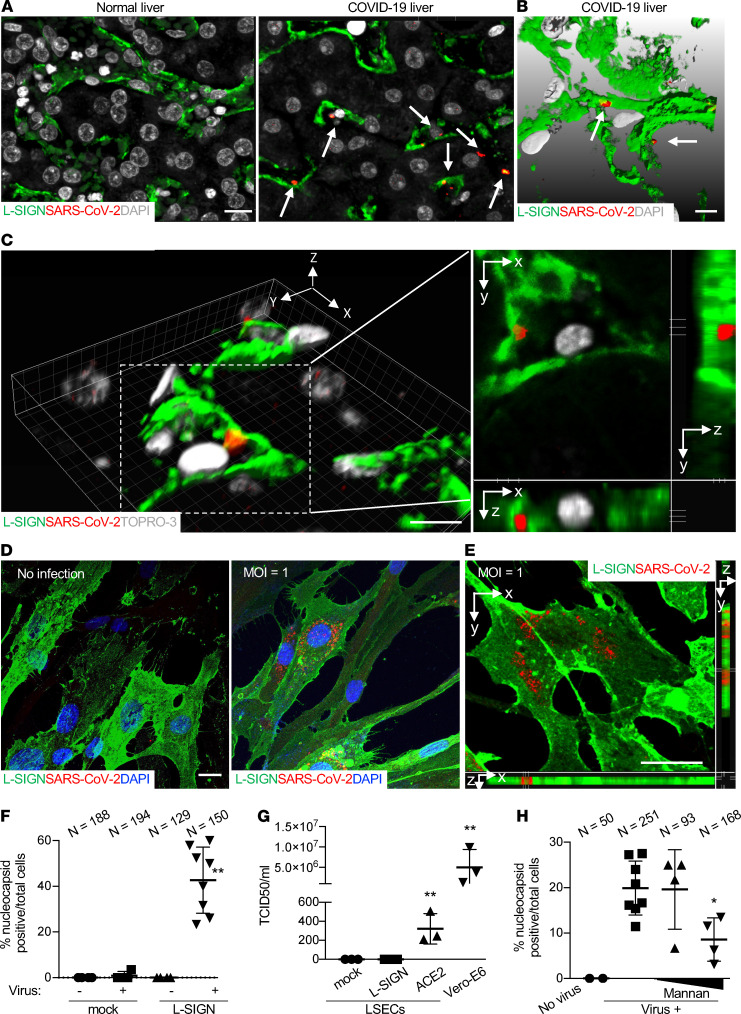
Figure 5. L-SIGN is a receptor for SARS-CoV-2 virus.
(A) Representative confocal microscopy images of SARS-CoV-2 nucleocapsid protein in LSECs from a COVID-19 liver autopsy sample. An uninfected normal human liver autopsy sample was used as a negative control. LSECs were L-SIGN+ (green). Arrows mark SARS-CoV-2 (red). DAPI (gray), nuclear staining. Scale bar: 10 μm. (B) Representative of 3D rendering of Z-stacked microscopy of liver sections from COVID-19 liver autopsy samples. Scale bars: 3 μm. Arrows mark SARS-CoV-2 protein particles (red) inside LSECs. Scale bar: 5 μm. (C) Representative 3D reconstructed confocal microscopy images of sections from a COVID-19 liver autopsy sample (left). Images on the right show orthogonal xy, xz, and yz projections of the dotted area to reveal the virus staining inside the LSEC. Scale bars: 10 μm. The results represent data from biopsy of autopsy samples of 4 independent patients with COVID-19 and 3 uninfected patients. (D) Representative confocal microscopy images of cultured L-SIGN-flag–expressing LSECs infected with authentic SARS-CoV-2 (MOI = 1). Scale bar: 5 μm. Blue (DAPI), nuclear staining; green, L-SIGN; red, nucleocapsid protein. (E) A 3D microscopy view of L-SIGN-flag–expressing LSECs infected with authentic SARS-CoV-2 (MOI = 1). Scale bar: 5 μm. Green, L-SIGN; red, nucleocapsid protein. (F) Percentage of nucleocapsid protein+ cells per total cells in 4–8 ×40 fields in mock- or L-SIGN-flag–transduced LSECs. (G) Median tissue culture infectious dose (TCID50) virus titer assay of supernatants 2 days after infection in mock-, L-SIGN-flag–, or ACE2-myc3–transduced LSECs. Infected Vero-E6 cells were positive control in terms of their permissiveness for high viral productivity. (H) Percentage of nucleocapsid protein+ cells per total L-SIGN-flag–transduced LSECs in the presence of mannan (100 and 500 μg/ml) in 4–8 ×40 fields in each group. *P < 0.01; **P < 0.0001. Bars indicate the mean; error bars represent mean ± SD. All experiments were at least repeated 3 times.

