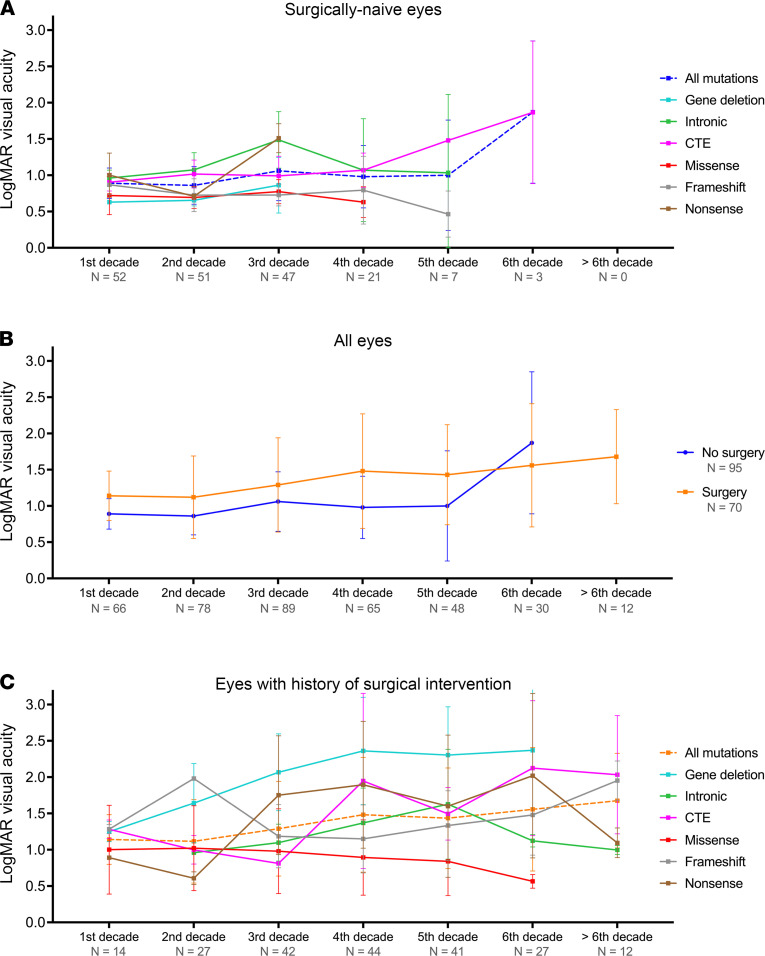
Figure 2. Best-corrected visual acuity in patients with PAX6 mutations.
Line charts demonstrate the longitudinal change in best-corrected visual acuity in this cohort in (A) different mutation groups with surgically naive eyes, (B) all eyes with or without surgical intervention, and (C) comparing mutation groups with a history of surgical intervention. Data represent mean ± SD. LogMAR, logarithm of the minimum angle of resolution, CTE, C-terminal extension.

