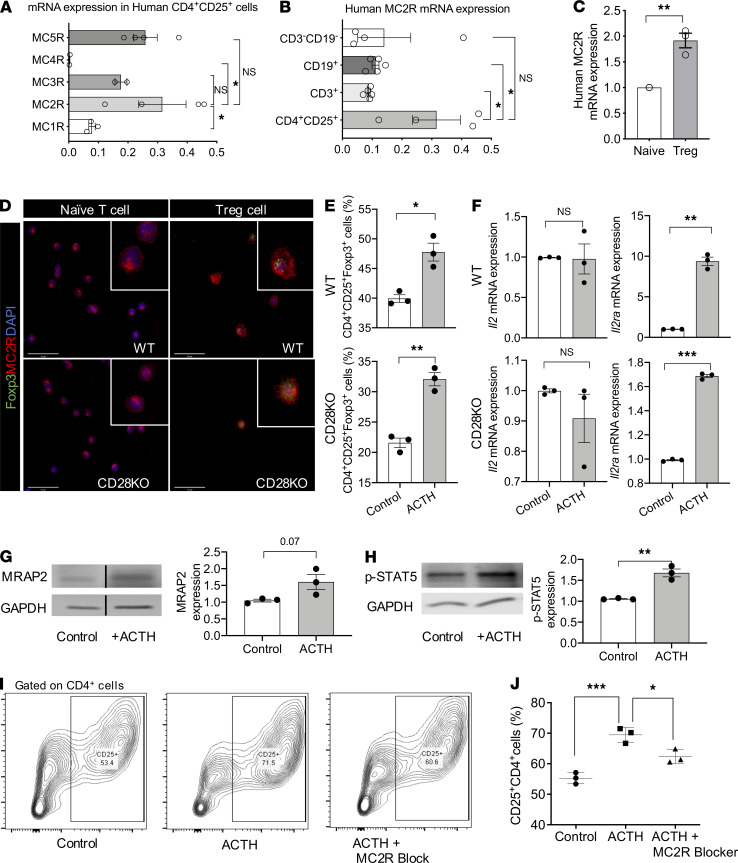
Figure 1. ACTH induces formation of Tregs through MC2R.
(A) Comparison of MC1R, MC2R, MC4R, and MC5R gene expression by human CD4+CD25+ cells by qPCR (n = 3–5/group). (B) Comparison of MC2R gene expression by human CD3–CD19– cells, CD19+ B cells, CD3+ T cells, and CD4+CD25+ T cells by qPCR (n = 3–5/group). (C) Comparison of MC2R gene expression by human Tregs versus naive T cells by qPCR (n = 3/group). (D) Immunofluorescence staining of MC2R expression in mouse Tregs and non-Tregs from WT and CD28KO mice. Scale bar: 50 μm. (E) Flow cytometric analysis of percentage of CD4+CD25+Foxp3+ cells (Tregs) in Treg induction assay of splenocytes from WT and CD28KO mice, following either treatment with ACTH or no treatment (Control). (F) Comparison of gene expression of Il2ra and Il2 by Tregs of WT and CD28KO mice, following either ACTH treatment or no treatment (Control), by qPCR. (G) Comparison of MRAP2 protein expression by Tregs from CD28KO mice following ACTH treatment or no treatment (Control) by Western blot (P = 0.07). (H) Comparison of p-STAT5 gene expression by Tregs from CD28KO mice following ACTH treatment or no treatment (Control) by Western blot. (I) Representative flow cytometric plots of CD25 expression by CD4+ cells in Treg induction assay following treatment with ACTH and MC2R blocker. (J) Flow cytometric analysis of percentage of CD25+CD4+ cells following treatment with ACTH, ACTH, and MC2R blocker, or no treatment (Control) (n = 3/group). Data presented as mean ± SEM; *P < 0.05, **P < 0.01, ***P < 0.001 by 2-way ANOVA with Turkey’s multiple comparisons (A, B, and J) and Student’s t test (C, E–H).

