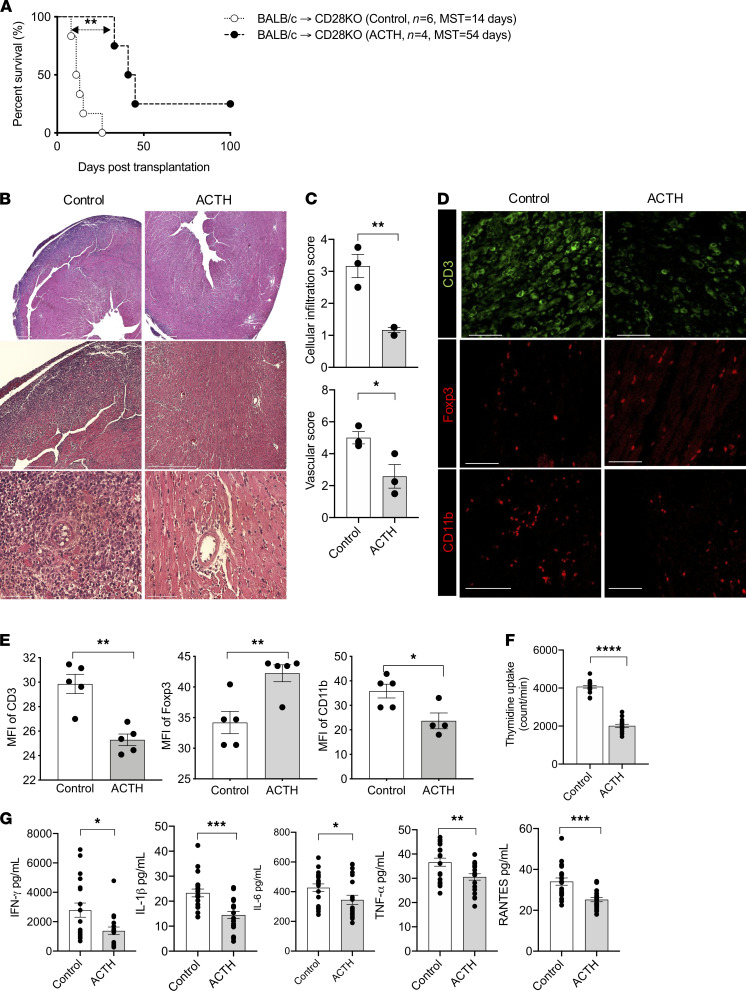
Figure 2. ACTH improves graft survival in CD28KO mice.
(A) Comparison of heart allograft survival in CD28KO recipients of BALB/c hearts that received either ACTH (n = 4 mice/group; MST, 54 days) or no treatment (Control; n = 6 mice/group; MST, 14 days). **P < 0.01 by log-rank test. (B) Representative light micrographs of H&E-stained heart allograft sections from CD28KO recipients following either ACTH treatment or no treatment (Control) at day 7. Scale bars: 750 μm, 500 μm, and 75 μm (from top to bottom). (C) Comparison of cellular infiltration and vascular damage of the heart allografts in CD28KO recipients following either ACTH treatment or no treatment (Control). (D) Representative fluorescence micrographs of CD3+ T cell, CD11b+ cell, and Foxp3+ Treg populations in heart allograft sections following ACTH treatment or no treatment (Control: day 7 after transplant). Scale bars: 50 μm. (E) Bar graphs show comparison of MFIs of CD3, Foxp3, and CD11b staining in heart allograft sections following ACTH treatment or no treatment (Control: day 7 after transplant) (n = 3 mice/group). (F) T cell stimulation assay following ACTH treatment or no treatment. (G) Quantification of IFN-γ, IL-1β, IL-6, TNF-α, and RANTES concentrations following ACTH treatment or no treatment (Control) by ELIspot and Luminex assay. Data presented as mean ± SEM; *P < 0.05, **P < 0.01, ***P < 0.001 by Student’s t test.

