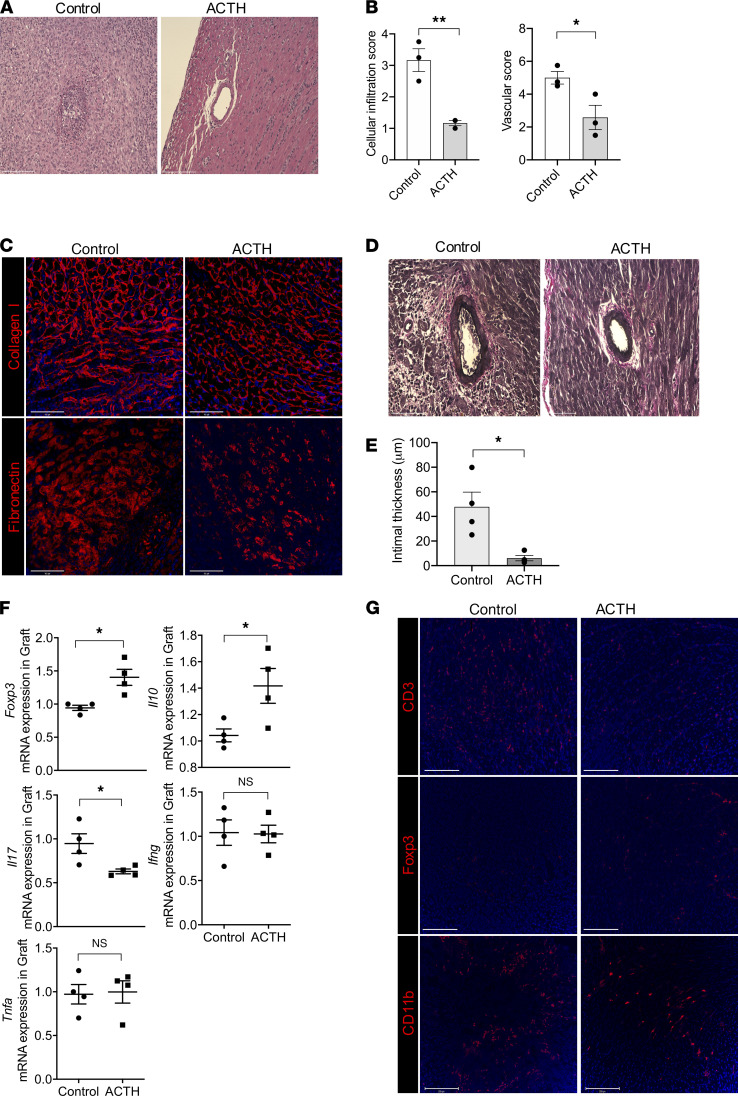
Figure 5. ACTH treatment ameliorated cardiac transplant vasculopathy.
(A) Representative light micrographs of H&E-stained BM12 heart allograft sections around 4 weeks from C57BL/6 recipients following either ACTH treatment or no treatment (Control). Scale bar: 75 μm. (B) Comparison of cellular infiltration and vascular damage of the BM12 heart allografts from C57BL/6 recipients following either ACTH treatment or no treatment (Control) (n = 4 mice/group). (C) Representative fluorescence micrographs of fibronectin and collagen I fibers in the BM12 heart allografts from C57BL/6 recipients following either ACTH treatment or no treatment. Scale bar: 100 μm. (D) Light micrographs of Verhoeff’s-stained heart allograft sections from C57BL/6 recipients of BM12 heart allografts following either ACTH treatment or no treatment. Scale bar: 75 μm. (E) Bar graph shows comparison of intimal thickness in Verhoeff’s-stained BM12 heart allograft sections from C57BL/6 recipients following either ACTH treatment or no treatment (n = 4 mice/group). (F) Comparison of Foxp3, Il10, Il17, Ifng, and Tnfa gene expression between BM12 heart allografts in C57BL/6 recipients following either ACTH treatment or no treatment (Control) (n = 4 mice/group). (G) Representative fluorescence micrographs of CD3+ T cell, CD11b+ cell, and Foxp3+ Treg populations in BM12 heart allografts in C57BL/6 recipients following either ACTH treatment or no treatment (Control). Scale bar: 100 μm. Data presented as mean ± SEM; *P < 0.05, ***P < 0.001 by Student’s t test.

