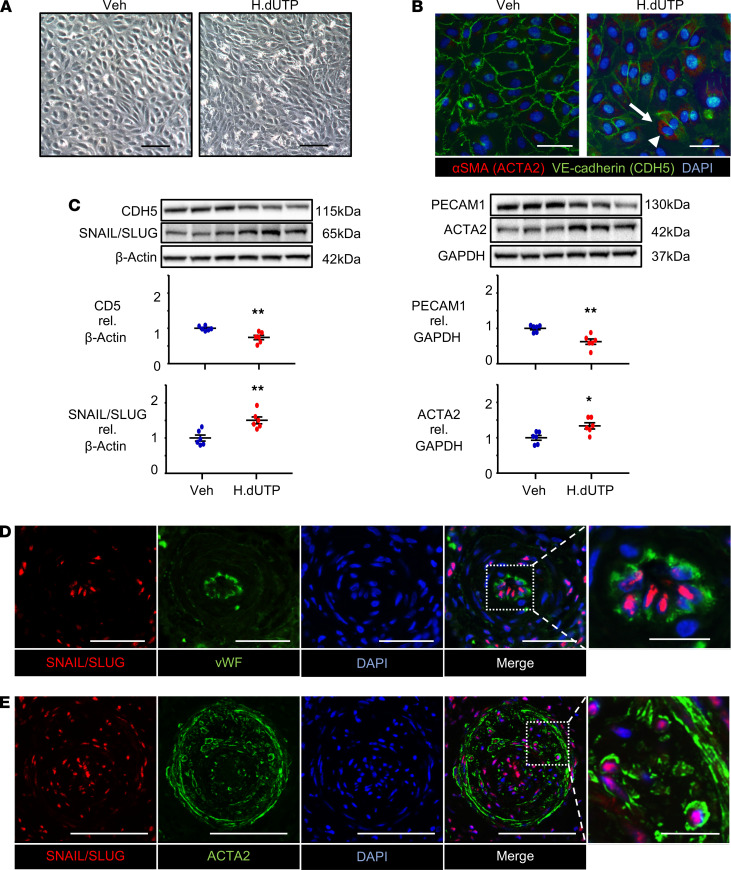
Figure 1. Recombinant HERV-K dUTPase upregulates SNAIL and induces features of EndMT in PAECs.
PAECs used at passage 3–8 were treated with 10 μg/mL HERV-K dUTPase (H.dUTP) or with PBS vehicle (Veh) daily for 3 days, then every 3 days up to 10 days. (A) Representative phase-contrast light microscopic images, showing the typical cobblestone morphology of control PAECs treated with vehicle versus an elongated spindle shape morphology of HERV-K dUTPase treated PAECs. Scale bar: 100 μm. (B) Immunofluorescence microscopy images showing elongated PAECs expressing αSMA (ACTA2) (red) (arrowhead) and greatly diminished VE-cadherin (CDH5) (green) (arrow) in the HERV-K dUTPase-treated PAECs. Scale bar: 50 μm. (C) Representative immunoblot and densitometric analysis of protein expression normalized to β-Actin or GAPDH, assessed at 10 days. Individual data points are shown, with n = 6, mean ± SEM. *P < 0.05; **P < 0.01 versus Veh, by unpaired Student’s t test. (D) Representative confocal images of a small PA from 1 of 2 patients with PAH stained for the EndMT transcription marker SNAIL/SLUG (red), the endothelial marker vWF (green), and DAPI (blue), showing SNAIL/SLUG localized to vWF positive PAECs in occlusive lesions (Control in Supplemental Figure 1C). Scale bar: 20 μm (10 μm in magnified panel, far right). (E) Representative confocal image of a large PA stained for SNAIL/SLUG (red), ACTA2 as a SMC marker (green), and DAPI (blue), showing SNAIL/SLUG localized to ACTA2-positive cells in an occlusive lesion from 1 of 2 patients with PAH. Scale bar: 50 μm (10 μm in magnified panel, far right).

