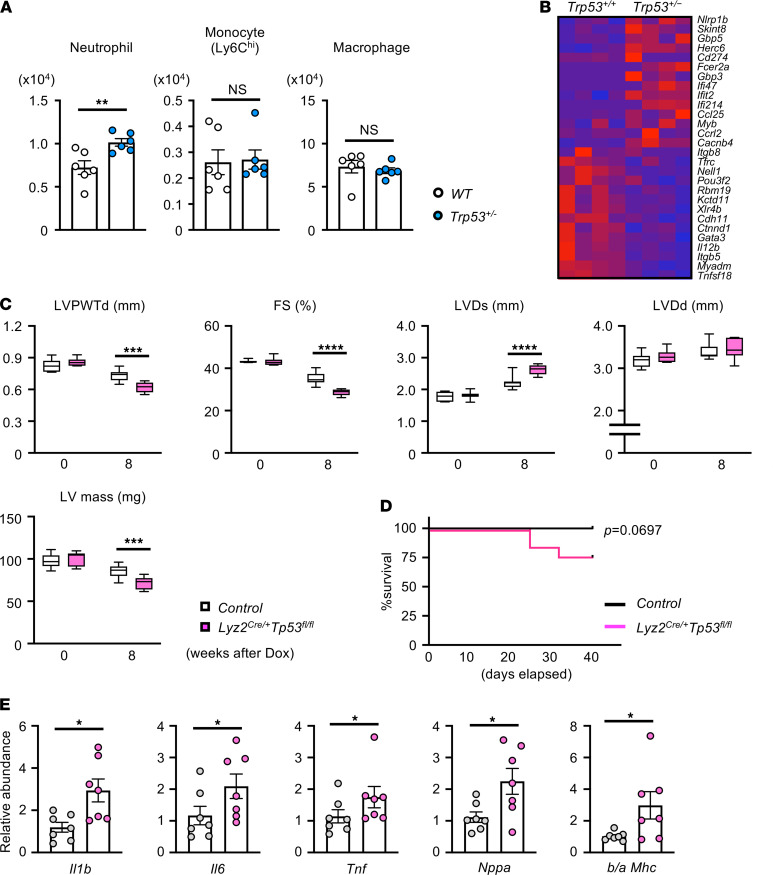
Figure 3. Trp53-deficient myeloid cells accelerate Dox-induced cardiotoxicity.
(A) Flow cytometry analysis of cardiac immune cells from mice that underwent competitive BMT and Dox administration. In this study, mice underwent partial (30%) bone marrow reconstitution with Trp53-deficient cells (30% Het BMT mice) or WT cells (30% WT BMT mice). After a 7-week recovery from BMT, mice were injected intraperitoneally with Dox (single injection of 15 μg/g), and hearts were harvested 7 days later for flow cytometry analysis of resident immune cells (n = 6). Statistical analysis was performed with unpaired (2-tailed) Student’s t test (neutrophil) and Mann-Whitney U tests (Ly6Chi monocyte, macrophage). (B) Heatmap of select group of the most highly differentially expressed genes from the highest ranked annotation categories comparing blood neutrophils between Trp53-sufficient (Trp53+/+) and Trp53 heterozygous–deficient mice (Trp53+/–) at 1 day after Dox administration (15 μg/g single injection). Mice were administered Dox by intraperitoneal injection (15 mg/kg split into 3 injections over 10 days). (C) Echocardiographic analysis of left ventricular posterior wall thickness diameter (LVPWTd; mm), fractional shortening (FS; %), left ventricular end-systolic diameter (LVDs; mm), left ventricular end-diastolic diameter (LVDd; mm), and left ventricular mass (LV mass; mg) of myeloid-specific Trp53-deficient (Lyz2Cre/+Tp53fl/f) mice and littermate controls (Control) before and at 8 weeks after Dox administration. Statistical analysis was performed with 2-way repeated-measures ANOVA with Sidak’s multiple-comparisons tests (n = 7 per group). (D) Survival of myeloid-specific Trp53-deficient mice and littermate controls after Dox administration. Survival curve was obtained by the Kaplan-Meier method. Statistical analysis was performed with log-rank test (n = 12 per genotype). (E) Real-time qPCR analysis of transcript expression in myocardium obtained from Lyz2Cre/+Trp53fl/fl and littermate control mice at 8 weeks after Dox treatment (n = 7 per genotype). Statistical analysis was performed with unpaired (2-tailed) Student’s t test (Il6, Il1b, b/a MHC), 2-tailed unpaired Student’s t test with Welch correction (Nppa), or Mann-Whitney U test (Tnf). *P < 0.05, **P < 0.01, ***P < 0.001, ****P < 0.0001.

