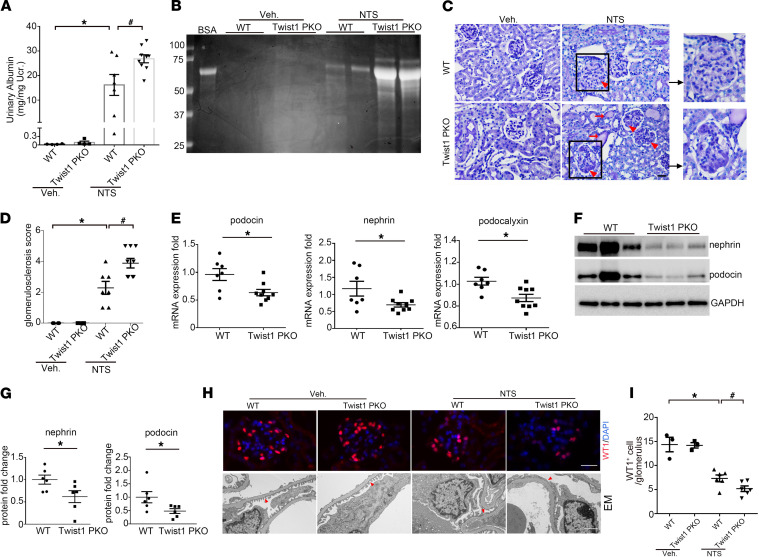
Figure 3. Twist1 in podocytes limits albuminuria and podocyte injury induced by NTS in mice.
(A) Urinary albumin concentration in WT and Twist1-PKO mice on day 9 vehicle or NTS (n = 4–9, Kruskal-Wallis test). (B) Representative SDS-PAGE showing the urine proteins in cohorts of mice. (C) Representative images of kidney sections from WT and Twist1-PKO mice on day 9 vehicle or NTS. Red arrowheads indicate glomerulosclerosis; red arrows indicate tubular casts. Scale bar: 40 μm. (D) Kidney glomerulosclerosis scores in groups (n = 4–9, Kruskal-Wallis test). (E) Renal mRNA expression of podocin, nephrin, and podocalyxin in WT and Twist1-PKO mice after NTS injection (7–9, t test). (F) Representative Western blots for nephrin and podocin proteins in glomeruli isolated from WT and Twist1-PKO mice on day 4 NTS. (G) Semiquantitative determination of nephrin and podocin protein levels from blots in F (n = 7–9, t test). (H) Representative immunostaining for WT1 protein in the groups and electron microscopy showing the glomerular filtration barrier in the groups. (I) Quantitative determination of WT1-positive cells in glomeruli in different groups (n = 3–6, Student-Newman-Keuls test). Data represent mean ± SEM. All t tests were 2 tailed. *P < 0.05, #P < 0.05. Red arrowheads indicate foot processes. Scale bar: 40 μm (upper), 1 μm (lower). veh, vehicle; NTS, nephrotoxic serum; EM, electron microscopy; Twist1-PKO, Pod-Cre Twist1fl/fl.

