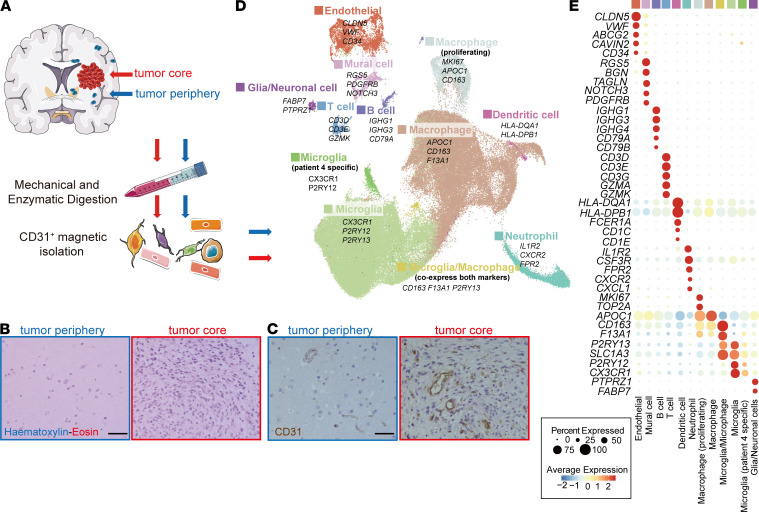
Figure 1. Overview of the CD31-MACS–enriched single cells from GBM and peripheral brain samples.
(A) Schematic overview of the study design. (B and C) HE staining (B) and IHC staining of CD31 (C) in GBM tumor core and tumor peripheral tissue. (D) UMAP of transcriptome from CD31-MACS–enriched cells, colored for the 12 clusters. (E) Dot plot heatmap of the marker genes in individual clusters. Scale bar: 50 μm.

