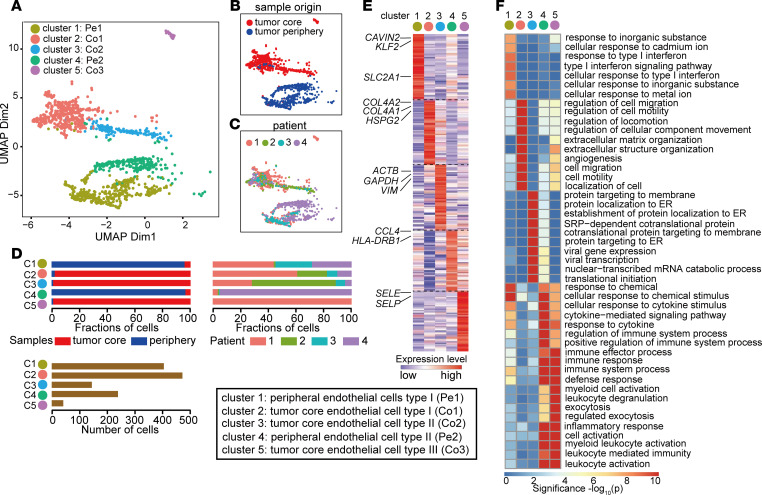
Figure 2. Construction of the EC atlas from GBM and peripheral brain tissue.
(A–C) UMAP of endothelial cells, colored by clusters (A) or sample type of origin (B) or individual patient (C). (D) Relative contribution of endothelial cells from sample origin type (left) and individual patient (right). The number of cells in each subclusters (bottom). (E) Gene expression levels of top 50 marker genes in different endothelial subclusters. For complete list, see Supplemental Table 4. (F) Heatmap showing top 10 enriched GO terms in different endothelial subclusters based on top 50 marker genes.

