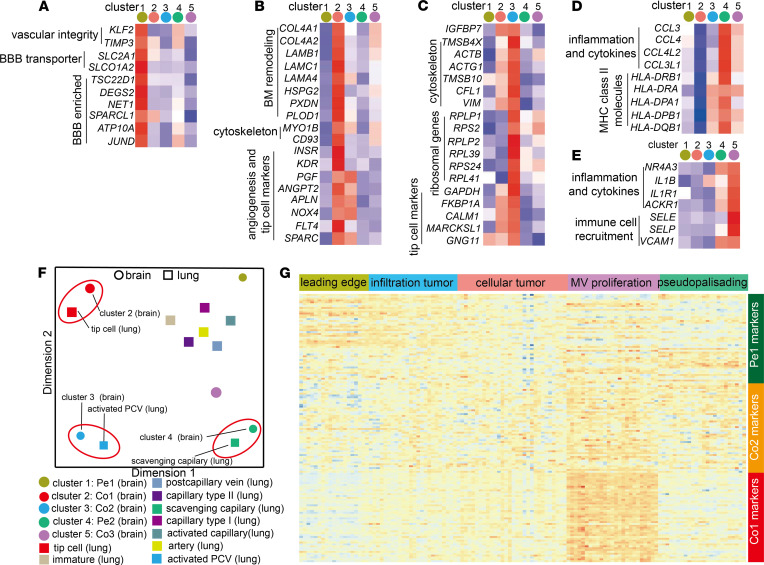
Figure 3. Characterization of different EC phenotypes.
(A–E) Expression levels of selected marker genes of cluster 1 (Pe1) ECs (A), cluster 2 (Co1) ECs (B), cluster 3 (Co2) ECs (C), cluster 4 (Pe2) ECs (D), and cluster 5 (Co3) ECs (E). (F) Multidimensional scaling (MDS) on the Jaccard similarity coefficients of the top 50 marker gene sets among endothelial subclusters in brain (and GBM) and lung (and lung cancer). (G) The normalized expression of top 50 markers for Pe1 ECs, Co1 ECs, and Co2 ECs in Ivy GAP RNA-seq of distinct GBM-anatomic structures.

