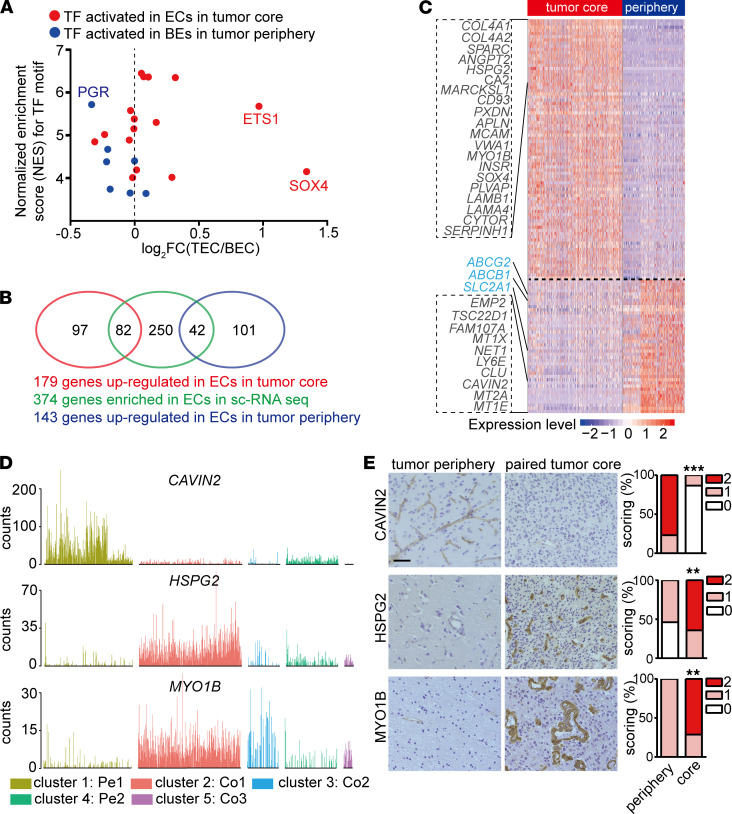
Figure 4. ECs in tumor core are distinct from ECs in peripheral brain tissue.
(A) Plot of transcription factor activity score estimated by SCENIC to fold change of their expression between ECs in periphery and tumor core. Red/blue dot corresponds to transcription factor activated in ECs in the tumor core or tumor periphery, respectively. (B) Venn diagram illustrating the overlaps of 374 EC-enriched genes with differentially expressed genes between ECs in tumor core and tumor periphery. (C) Heatmap showing differentially expressed EC-enriched genes between ECs in the tumor core and peripheral brain tissue. (D) Bar plots of CAVIN2, HSPG2, and MYO1B among different EC subclusters. (E) IHC staining and quantification of CAVIN2, HSPG2, and MYO1B in human GBM tumor core and paired peripheral brain tissue (CAVIN2, n = 13; HSPG2, n = 13; MYO1B, n = 14). Staining was scored semiquantitatively on scale from 0 to 2 based on proportional of vessels stained (Wilcoxon test, **P < 0.01, ***P < 0.001). Scale bar: 50 μm.

