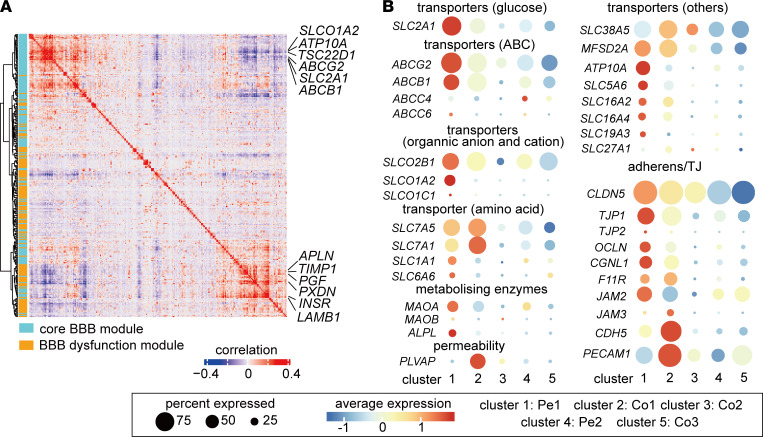
Figure 5. ECs in GBM are associated with compromised BBB phenotype.
(A) Correlation plot showing correlation coefficient of genes in BBB and BBB dysfunctional module. (B) Dot plot showing differential expression patterns of different transporters, metabolizing enzymes, adherens/tight junctions, and permeability genes implicated in BBB functions among different clusters.

