. 2021 Aug 31;10:e67259. doi: 10.7554/eLife.67259

Figure 1. TGFβ signalling pathway is active in human naïve pluripotent stem cells.

(a) Overview of the TGFβ signalling pathway. Extracellular ligands ACTIVIN and NODAL bind to type I (ACVR2A/2B) and type II transmembrane receptors (ALK4/7), and TGFβ binds to TβRI and TβRII/ALK5. NODAL requires the additional transmembrane co-receptor TDGF1 (CRIPTO1). The activated receptor complex phosphorylates the linker region of SMAD2 and SMAD3, which enter the nucleus in complex with SMAD4. They act as transcriptional regulators and induce or repress the transcription of their target loci by recruiting other transcription factors (TF) and epigenetic modifiers. Several negative regulators of the signalling pathway are also shown: LEFTY1/2 block the signalling pathway by binding to the receptors; Cerberus (CER) and Follistatin (FST) block the ligands; SMAD7 inhibits the SMAD2/3 complex. (b) 10X RNA-seq data of naïve and primed hPSCs represented on a UMAP plot. (c) UMAP visualisation of naïve and primed hPSCs reporting the relative expression of respective pluripotent state markers, KLF4 and ZIC2. (d) Heatmap reporting the expression values of selected naïve and primed marker genes divided in pan-pluripotency markers, and naïve- and primed-specific markers within the top 250 differentially expressed genes. (e) Violin plots of the 10X RNA-seq data comparing the transcript expression of TGFβ effectors in naïve and primed hPSCs. (f) Heatmap summarising the transcript expression of TGFβ effectors and pluripotency genes. RNA-seq datasets shown are: in vitro-cultured naïve and primed hPSCs (Collier et al., 2017), hPSCs undergoing naïve to primed state capacitation (Rostovskaya et al., 2019), human pre-implantation embryos (Petropoulos et al., 2016), and epiblast cells within a 3D human blastocyst culture system (Xiang et al., 2020). X8c: 8-cell stage; MOR: morula; eICM: early-ICM; eTE: early-trophectoderm; EPI: epiblast; PE: primitive endoderm; TE: trophectoderm. Dpf: days post-fertilisation. (g) Heatmaps summarising protein abundance levels determined by cell-surface proteomics (Wojdyla et al., 2020) and whole cell proteomics (Di Stefano et al., 2018) for TGFβ effectors in naïve and primed hPSCs. (h) Western blot analysis of TGFβ signalling pathway activation in H9 primed hPSCs (cultured in E8 medium) and in three naïve hPSC lines cultured in t2iLGö medium: embryo-derived HNES1, chemically reset cR-H9, and transgene-reset H9 NK2. Blots show SMAD2 phosphorylation signal (pSMAD2-Ser465/Ser467) and total SMAD2/3 levels in normal conditions (-), and following 1 hr and 24 hr of SB-431542 supplementation to their culture media. Vinculin (VCL) used as a loading control.

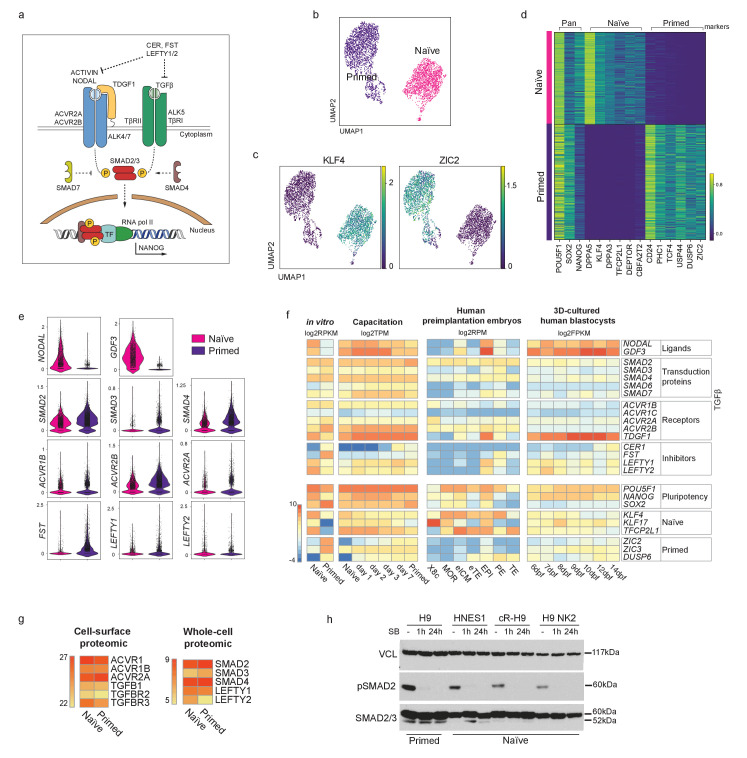
Figure 1—source data 1. Full uncropped western blot from Figure 1h and Figure 1—figure supplement 1e reporting TGFβ pathway activation in primed H9 cells (cultured in E8 medium) and in three naïve hPSC lines cultured in t2iLGö medium: embryo-derived HNES1, chemically reset cR-H9, and transgene-reset H9 NK2 naïve cells.
Blots show SMAD2 phosphorylation signal and total SMAD2/3 in normal conditions (-), and following 1 hr and 24 hr of SB-431542 supplementation to their culture media. Two separate exposures are shown, Vinculin (VCL) used as loading control. (a) Original files of the full raw unedited blots. (b) Figures with the uncropped blots with the bands reported in the main figures highlighted in red and labelled accordingly.

Figure 1.

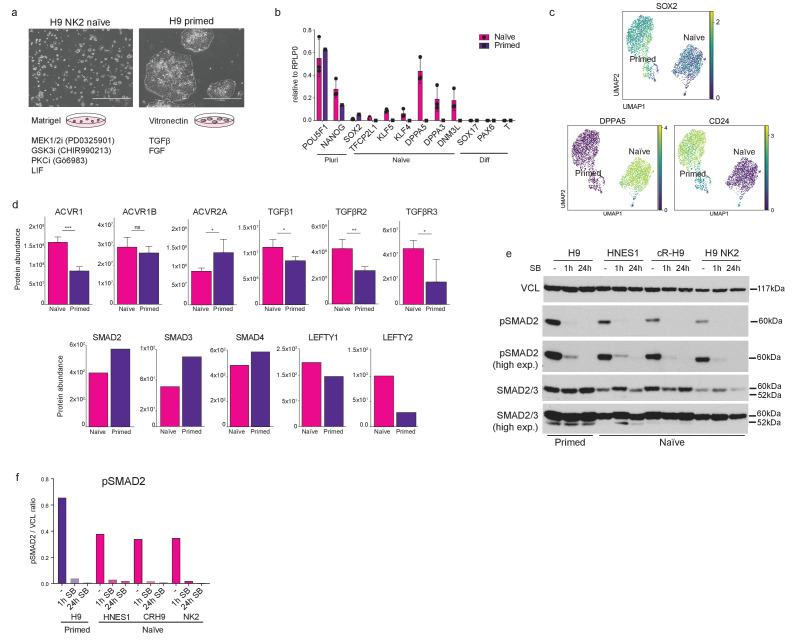
Figure 1—figure supplement 1. Validation of naïve and primed hPSCs and TGFβ signalling pathway activation.

Figure 1—figure supplement 1.

(a) Overview of the conditions used for culturing naïve and primed hPSCs and representative phase-contrast images. (b) RT-qPCR expression analysis of pan-pluripotency genes (Pluri), naïve markers (naïve) and early-stage germ cell layer markers (Diff) in naïve and primed hPSCs. Data show the mean ± SD of three biological replicates, relative to the housekeeping gene RPLP0. (c) UMAP visualisation of naïve and primed cells reporting the relative expression of pluripotency marker SOX2, naïve marker DPPA5, and primed marker CD24. (d) Protein abundance levels for several TGFβ receptors (upper; Wojdyla et al., 2020) and transduction proteins (lower; Di Stefano et al., 2018) in naïve and primed hPSCs. The upper charts show the mean ± SD of three (naïve) or four (primed) biological replicates and were compared using a LIMMA-moderated t test with Benjamini-Hochberg correction (ns, q > 0.05, *q < 0.05, **q < 0.01, ***q < 0.001, ****q < 0.0001). The lower charts show protein abundance of one biological replicate per cell type. (e) Expanded western blot from Figure 1h comparing TGFβ pathway activation in primed H9 cells (cultured in E8 medium) and in three naïve hPSC lines cultured in t2iLGö medium: embryo-derived HNES1, chemically reset cR-H9, and transgene-reset H9 NK2 naïve cells. Blots show SMAD2 phosphorylation signal and total SMAD2/3 in normal conditions (-), and following 1 hr and 24 hr of SB-431542 supplementation to their culture media. Two separate exposures are shown. Vinculin (VCL) used as loading control. (f) Relative quantification of western blot from Figure 1h performed using the software Fiji (ImageJ) reporting the pSMAD2 / Vinculin (VCL) ratio.
Figure 1—figure supplement 1—source data 1. Numerical data that are represented in Figure 1—figure supplement 1.