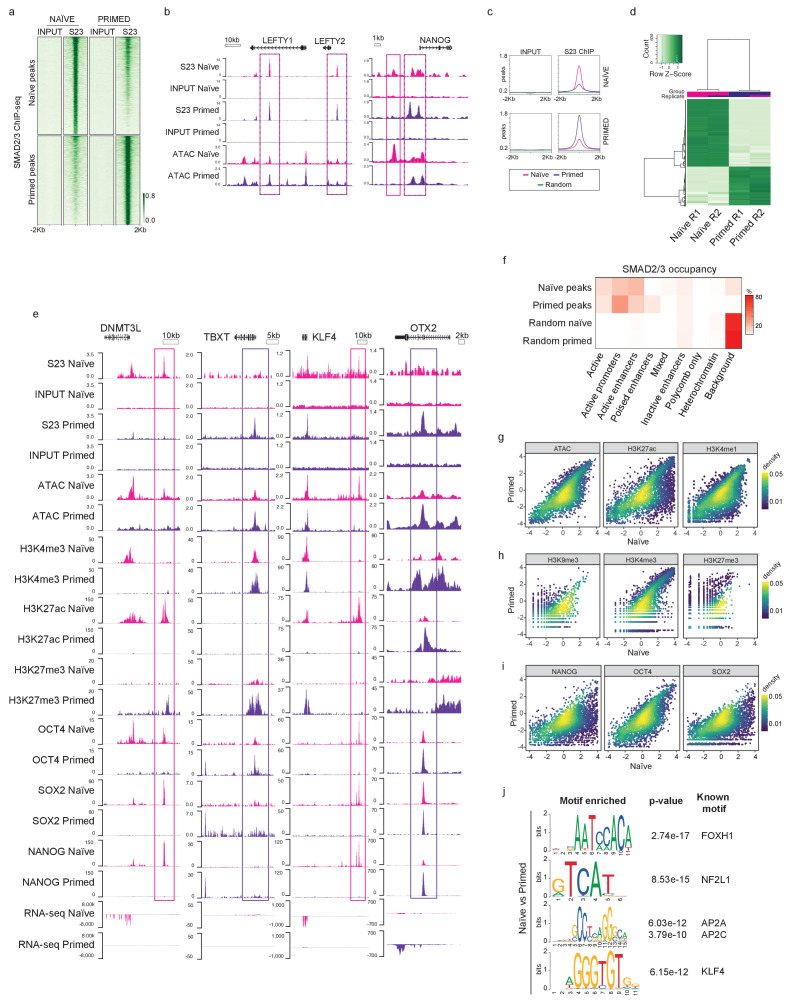
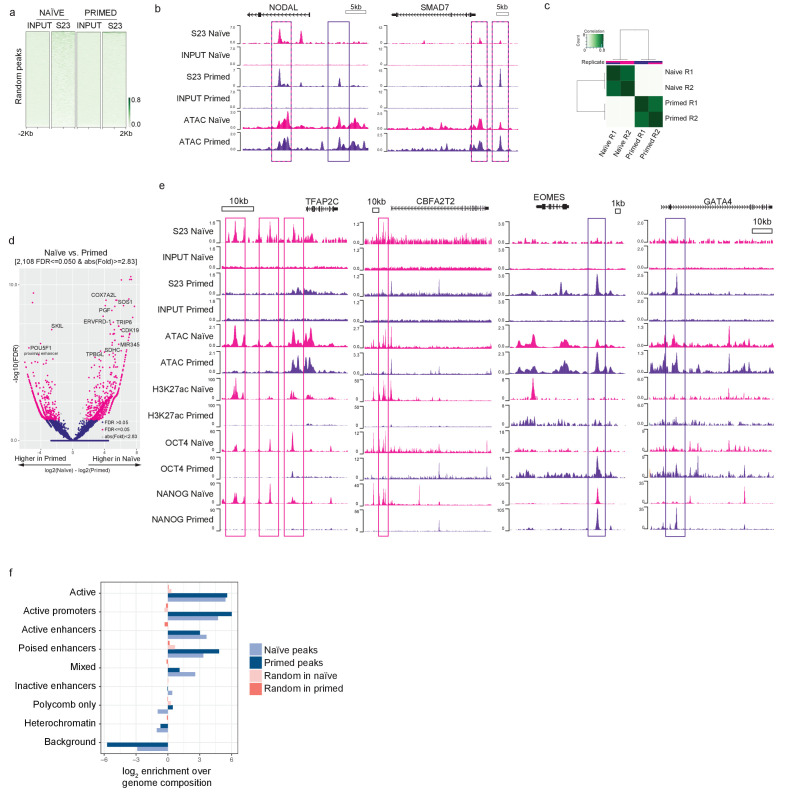
Figure 2. SMAD2/3 binds to chromatin at common and pluripotent state-specific sites.
(a) Heatmap displaying normalised SMAD2/3 (S23) ChIP-seq reads ±2 kb from the centre of SMAD2/3-bound peaks that were independently defined in naïve (H9 NK2 line cultured in t2iLGö medium) and primed (H9 line cultured in E8 medium) hPSCs; two biological replicates per cell line. Top panel shows the regions identified as SMAD2/3-bound peaks in naïve cells; lower panel shows SMAD2/3-bound peaks in primed cells. (b) Genome browser tracks reporting SMAD2/3 (S23) binding (this study) and chromatin accessibility (ATAC-seq; Pastor et al., 2018) at the LEFTY1/2 and NANOG loci in naïve and primed hPSCs. Input tracks are shown as controls. (c) Normalised average meta-plots of SMAD2/3 (S23) ChIP signal ±2 kb from the centre of the peaks in naïve and primed hPSCs, compared to a randomly-selected subset of regions. (d) Heatmap displaying regions that are differentially bound by SMAD2/3 in naïve and primed hPSCs in two biological replicates (R1 and R2). (e) Genome browser tracks reporting expression (RNA-seq), chromatin accessibility (ATAC-seq), and ChIP-seq datasets of SMAD2/3 (S23), histone marks for enhancers (H3K27ac) and promoters (H3K4me3, H3K27me3), and transcription factors (OCT4, SOX2, NANOG) at the DNMT3L, TBXT, KLF4, OTX2 loci. Input tracks are shown as controls. The following data sets are shown: ATAC-seq (Pastor et al., 2018); H3K4me3 (Theunissen et al., 2014); H3K4me1 (Chovanec et al., 2021; Gifford et al., 2013); H3K27me3 (Theunissen et al., 2014); H3K27ac (Ji et al., 2016); OCT4 (Ji et al., 2016); SOX2 (Chovanec et al., 2021); NANOG (Chovanec et al., 2021; Gifford et al., 2013), and RNA-seq (Takashima et al., 2014). (f) Heatmap showing the frequency of SMAD2/3 peak centre locations with respect to ChromHMM states in naïve and primed hPSCs (Chovanec et al., 2021). SMAD2/3 peaks in naïve and primed hPSCs were annotated with their respective ChromHMM states. The annotations associated with the randomly-selected control regions reflect the overall genomic representation of chromatin states. (g-i) Density coloured scatter plots showing indicated ChIP-seq and ATAC-seq values (log2 RPM) in naïve versus primed hPSCs. Each dot corresponds to one naïve-specific SMAD2/3 peak. (j) Differential motif enrichment reporting the top four motifs (ranked by p-value) at SMAD2/3-binding sites in naïve hPSCs that are enriched compared to motifs identified at SMAD2/3-binding sites in primed hPSCs.


