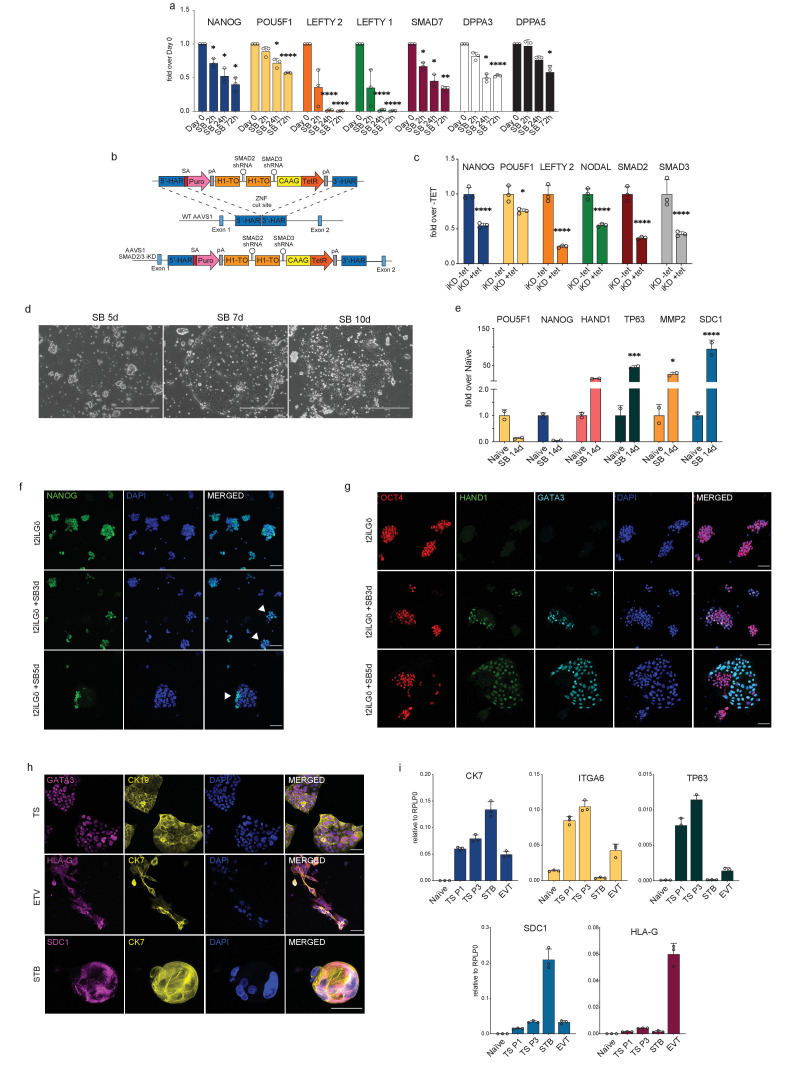
Figure 3. Inhibiting TGFβ signalling induces loss of pluripotency in naïve hPSCs.
(a) RT-qPCR expression analysis of pluripotency-associated genes and TGFβ-associated genes in naïve hPSCs (H9 NK2 line) following SB-431542 treatment (t2iLGö + SB). Expression levels are shown as fold changes relative to day 0. (b) Schematic showing the integration of a single-step optimised inducible knock-down targeting construct into the AAVS1 locus of H9 hPSCs, enabling the expression of SMAD2 and SMAD3 short hairpin RNAs (shRNAs) under the control of a tetracycline inducible promoter. ZFN: zinc-finger nucleases; 5’-HAR/3’-HAR: upstream/downstream homology arm; H1-TO: Tetracycline-inducible H1 Pol III promoter carrying one tet operon after the TATA box; CAAG: CMV early enhancer, chicken β-actin and rabbit β-globin hybrid promoter; TetR: Tetracycline-sensitive repressor protein; SA: splice acceptor; Puro, Puromycin resistance; pA, polyadenylation signal. Schematic adapted from Bertero et al., 2016. (c) RT-qPCR analysis of gene expression levels in SMAD2/3 inducible knock-down (iKD) H9 naïve hPSCs following 5 days of tetracycline (tet) treatment. Expression levels are shown for each gene as fold change relative to iKD -tet. Cells were cultured in t2iLGö medium. (d) Phase contrast pictures of H9 NK2 naïve hPSCs after 5, 7, and 10 days of SB treatment in t2iLGö medium. Scale bars: 400 µm. (e) RT-qPCR analysis of trophoblast (HAND1, TP63, MMP2, and SDC1) and pluripotency (POU5F1, NANOG) gene expression levels in naïve hPSCs following long-term (14 days) SB treatment in t2iLGö medium. Expression levels are shown as fold changes relative to day 0 samples, n = two biological replicates. (f) Immunofluorescence microscopy showing the downregulation of NANOG (green) in naïve hPSCs following 3 and 5 days of SB treatment. DAPI signal in blue. White arrowheads indicate colonies displaying heterogeneous expression of NANOG. Scale bars: 50 µm. (g) Immunofluorescence microscopy for OCT4 (red), HAND1 (green), GATA3 (cyan), and DAPI (blue) in naïve hPSCs following 3 and 5 days of SB treatment in t2iLGö medium. Scale bars: 50 µm. (h) Immunofluorescence microscopy for GATA3, HLA-G, SDC1 (magenta), CK19 and CK7 (yellow), and DAPI (blue) in naïve-derived trophoblast stem cells (TS), extravillous trophoblast (EVT), and syncytiotrophoblast (STB). Scale bars: 50 µm. (i) RT-qPCR analysis of gene expression levels in naïve-derived trophoblast stem cells (TS), extravillous trophoblast (EVT) and syncytiotrophoblast (STB) compared to undifferentiated naïve hPSCs. Expression levels are shown for each gene relative to the housekeeping gene RPLP0. RT-qPCR data show the mean ± SD of three biological replicates (unless specified otherwise) and were compared to their relative control using an ANOVA with Tukey's or Šídák's multiple comparisons test (*p ≤ 0.05, **p≤ 0.01, ***p≤ 0.001, ****p≤ 0.0001).


