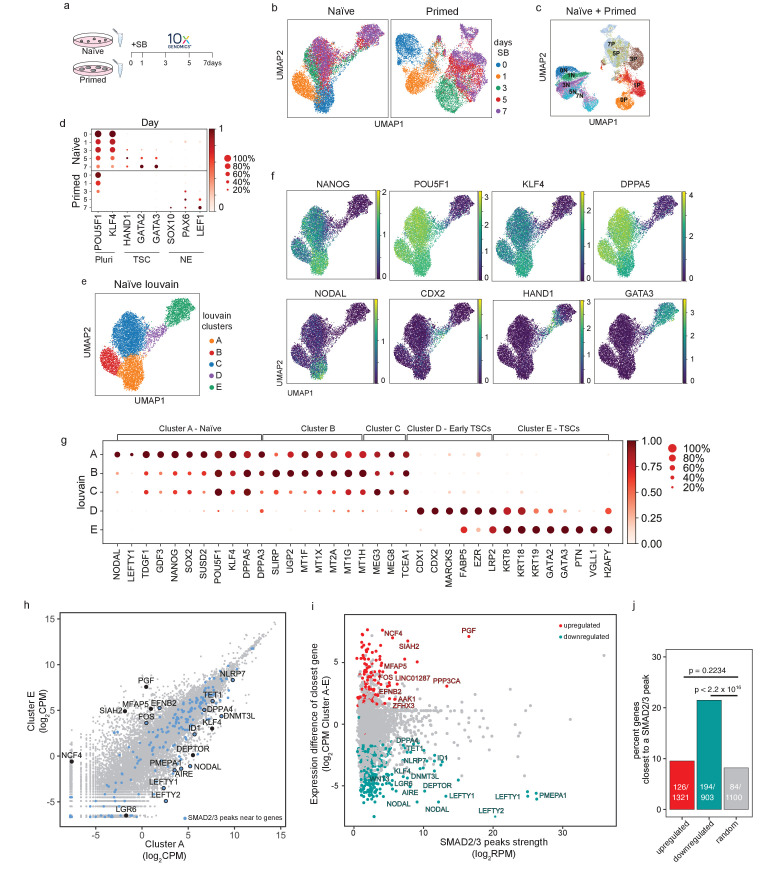
Figure 4. Single-cell transcriptional analysis reveals a trophoblast-like population arising in response to TGFβ inhibition in naïve hPSCs.
(a) Overview of the experimental procedure. Naïve and primed hPSCs were cultured in the presence of SB-431542 (SB), a potent TGFβ inhibitor, and samples were collected at days 0, 1, 3, 5, and 7. Single-cell transcriptomes were obtained by 10X sequencing. (b) UMAP visualisation of naïve and primed cells during the SB time-course experiment, separated by days of treatment. (c) UMAP visualisation of the combined naïve and primed data set, separated by days of SB treatment (indicated by the number in the labels). N, naïve; P, primed. (d) Dot plot of selected gene expression values in naïve and primed cells during the SB time-course experiment, plotted by days of treatment (in rows). Each dot represents two values: mean expression within each category (visualised by colour) and fraction of cells expressing the gene (visualised by the size of the dot). Genes are indicative of pluripotent cells (Pluri), trophoblast stem cells (TSC), and neuroectoderm cells (NE). (e) UMAP visualisation of naïve hPSCs during the SB time-course experiment, separated by Louvain clustering (five clusters, A to E). (f) UMAP visualisation of naïve cells during the SB time-course experiment, showing the relative expression of pluripotency markers, NANOG, POU5F1, KLF4, and DPPA5; TGFβ effectors, NODAL; and trophoblast markers, CDX2, HAND1, GATA3. (g) Dot plot of expression values in naïve cells during the SB time-course experiment, separated by the five Louvain clusters. The genes shown represent a subset of the top 25 differentially expressed genes between the five clusters, as reported in Figure 5—figure supplement 1e. Each dot represents two values: mean expression within each category (visualised by colour) and fraction of cells expressing the gene (visualised by the size of the dot). (h) Scatter plot reporting pseudobulk RNA-seq values (from 10X data) for cells in Louvain clusters A and E. Each dot represents one gene. Genes that have SMAD2/3 ChIP-seq peaks (log2 RPM > 5) within 12 kb of their transcription start site (TSS) are highlighted in blue and annotated. Several differentially expressed genes that are the closest gene to a SMAD2/3 peak (but are further away than 12 kb) are also named. (i) Scatter plot showing SMAD2/3 ChIP-seq peak strength (log2 RPM) versus the expression difference (cluster A – cluster E; log2 CPM) of the gene nearest to the SMAD2/3 peak. Upregulated genes, red; downregulated genes, green. (j) SMAD2/3 peaks were annotated with their nearest genes. Bar plot showing the percentage of genes that are the closest gene to a SMAD2/3 peak for genes that are upregulated (red) or downregulated (green) between cells in clusters A and E. A randomly selected set of control genes are shown in grey. The number of closest genes and the set size are reported within the bars. Statistical testing was performed using Chi-square test with Yates continuity and Bonferroni multiple testing correction.


