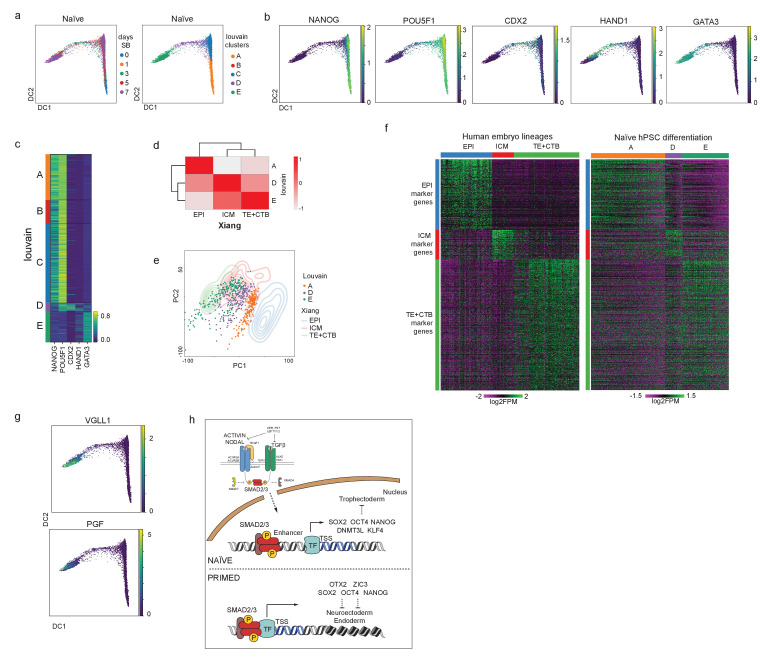
Figure 5. Differentiation of TGFβ-inhibited naïve hPSCs transcriptionally recapitulates early trophectoderm specification in human embryos.
(a) Diffusion maps of naïve cells during the SB time-course experiment, separated by days of treatment (left) and Louvain clustering (right). (b) Overlay of the diffusion maps with the relative expression of pluripotency markers NANOG, and POU5F1, and trophoblast markers CDX2, HAND1, GATA3. (c) Heatmap of the expression values of genes reported in (b) separated by the Louvain clusters. Note the overlap in the expression of pluripotency and trophoblast markers in cells within cluster D. (d) Correlation plot between pseudobulk data from Louvain clusters A/D/E and EPI (Epiblast), ICM (Inner Cell Mass), and TE+CTB (Trophectoderm+Cytotrophoblast) from cultured human pre-gastrulation embryos (Xiang et al., 2020). (e) PCA plot overlapping 200 randomly selected cells from each of the Louvain clusters A/D/E (individual dots) and data from 3D-cultured human pre-gastrulation embryos (Xiang et al., 2020), based on EPI, ICM, and TE+CTB cells (contour lines). PC1 variance 2.15, PC2 variance 1.41. (f) Heatmaps visualising the expression of genes in EPI, ICM, and TE+CTB (Xiang et al., 2020) and cells in Louvain clusters A/D/E. Note that the genes are in the same order for both plots. (g) Diffusion maps of naïve cells during the SB time-course experiment showing the relative expression of CTB markers – VGLL1 and PGF. (h) We propose there is a continuum of TGFβ/Activin/Nodal signalling that spans a developmental window of human pluripotent states from naïve to primed. In both states, active TGFβ signalling promotes the expression of common pluripotency genes, such as NANOG and POU5F1, and contributes to the maintenance of pluripotency. SMAD2/3 are additionally required in naïve hPSCs to sustain the expression of naïve pluripotency factors, including KLF4 and DNMT3L. Inactivating TGFβ signalling in naïve hPSCs leads to the downregulation of pluripotency genes, thereby enabling the induction of trophoblast differentiation.


