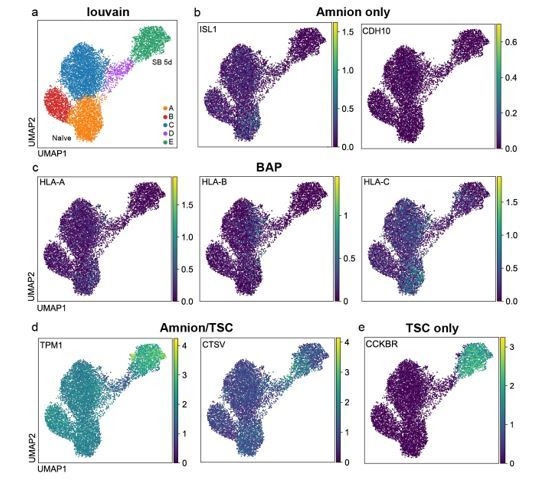
Author response image 1. UMAP visualisation of gene expression in naïve cells following TGFβ inhibition, as measured by 10X scRNA-seq.

a) Overview of the louvain clusters described in the manuscript. The plots show that reported b) amnion markers such as ISL1 and CDH10 (Guo et al., 2021) and c) BAP markers such as HLA-A/B/C (Io et al., 2021) are largely undetectable in this time course data set. d) TMP1 and CTSV are reported to be expressed in both trophoblast and amnion cells, and e) CCKBR is reported to be more abundant in trophoblast compared to amnion cells (Guo et al., 2021).
