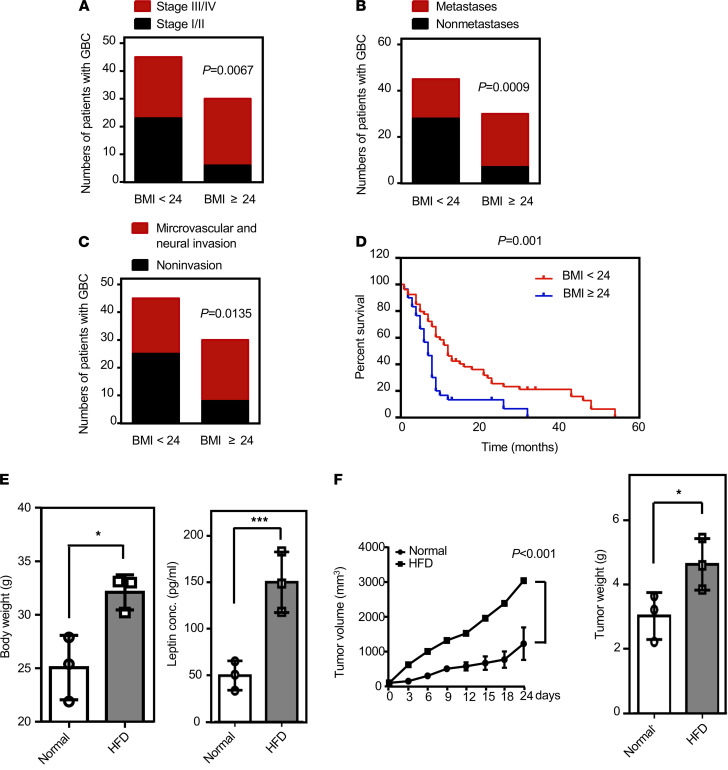
Figure 1. Evaluation of the significance of obesity in gallbladder cancer.
(A–C) Numbers of patients at different clinical stages for those with BMI ≥24 (n = 30) and BMI <24 (n = 45). Numbers of metastases and nonmetastases for patients with BMI ≥24 and BMI <24. Numbers of instances of microvascular and nonmicrovascular invasion for patients with BMI ≥24 and BMI <24 (χ2 test). (D) Kaplan-Meier plots of the overall survival of patients with GBC based on BMI <24 (n = 45) or BMI ≥24 (n = 30) (Cox proportional regression analysis). (E) Four-week-old male NOD/SCID mice were fed with normal diet or high-fat diet for 12 weeks and then sacrificed at the age of 16 weeks. Body weights of normal diet– and high-fat diet–fed mice (n = 4; *P < 0.05) were recorded, and circulating leptin levels were measured by ELISA (n = 4; ***P < 0.0001, 2-tailed Student’s t test). (F) After being fed a normal or a high-fat diet for 12 weeks, mice were injected with GBC cells RCB-1130 (4 × 10⁶/mice). Tumors were allowed to grow for 14 days, and tumor volume was measured twice per week for 4 weeks using a caliper. Tumor volume was calculated according to the formula (length × width2)/2. The mice were sacrificed at the end of the experiment, and the tumors were removed and weighed (n = 4; *P < 0.05, 2-tailed Student’s t test).

