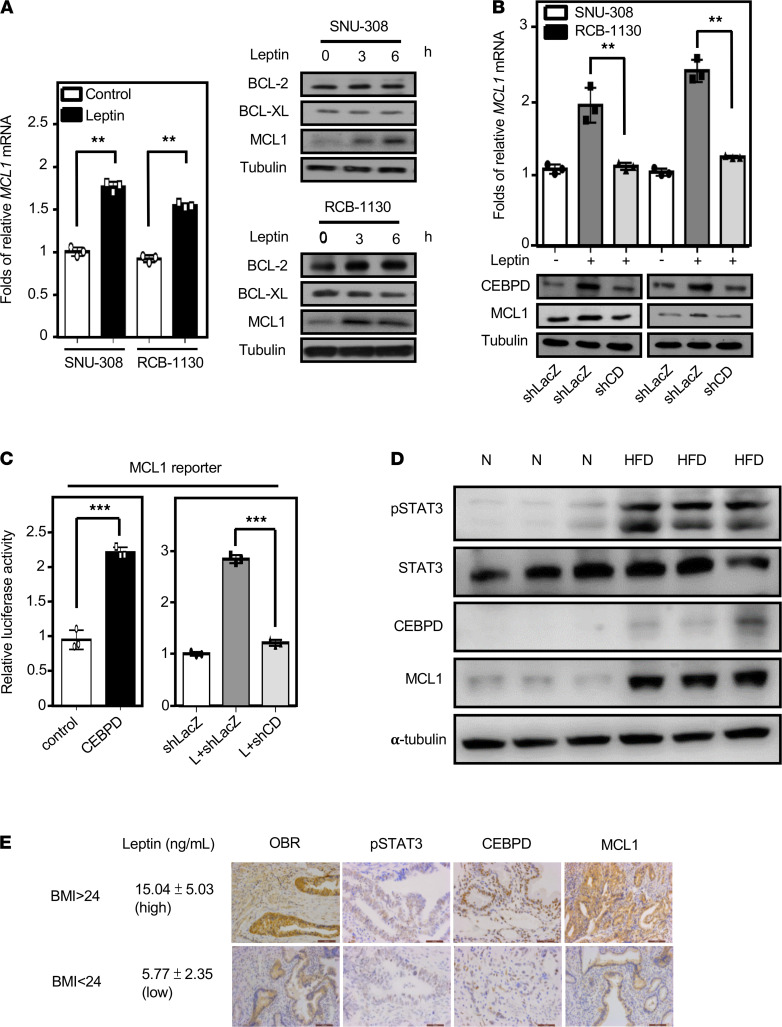
Figure 5. CEBPD activates MCL1 gene transcription in response to leptin and is involved in gallbladder cancer progression.
(A) Leptin induces MCL1 expression. Western blot analysis (n = 3) was conducted with lysates, and qPCR assays (n = 3; **P < 0.01, 2-tailed Student’s t test) were conducted with total RNA harvested from SNU-308 and RCB-1130 cells treated with leptin following various time courses. (B) Loss of CEBPD attenuates leptin-induced MCL1 expression. Cells were pretreated with lentiviruses containing shLacZ (LacZ) or shCEBPD (CDKD). After 48 hours of incubation, experimental cells were treated with leptin. qPCR assays (n = 3; **P < 0.01, 2-tailed Student’s t test) were conducted with total RNA, and Western blot analysis (n = 3) was conducted with lysates harvested from SNU-308 and RCB-1130 cells. (C) Loss of CEBPD attenuates leptin-induced MCL1 reporter activity. Graphs show cells transfected with expression vectors with or without CEBPD cDNA (CD and CTL, respectively) and cells that were pretreated with lentiviruses containing shLacZ (LacZ) or shCEBPD (CDKD). After 48 hours of incubation, experimental cells were treated with leptin. qPCR assays were conducted with total RNA harvested from SNU-308 and RCB-1130 cells (n = 3; ***P < 0.001, 2-tailed Student’s t test). (D) The pSTAT3/CEBPD/MCL1 axis is higher in RCB-1130 xenograft HFD-fed mice. After injecting gallbladder cancer RCB-1130 cells into normal and HFD-fed obese mice for 4 weeks, the xenograft mice were sacrificed to extract tumor xenografts. The protein expression was then examined by Western blot (n = 3). (E) Serum leptin levels and OBR, p-STAT3, CEBPD, and MCL1 expression were detected by ELISA and IHC (n = 75). Scale bar: 100 μm.

