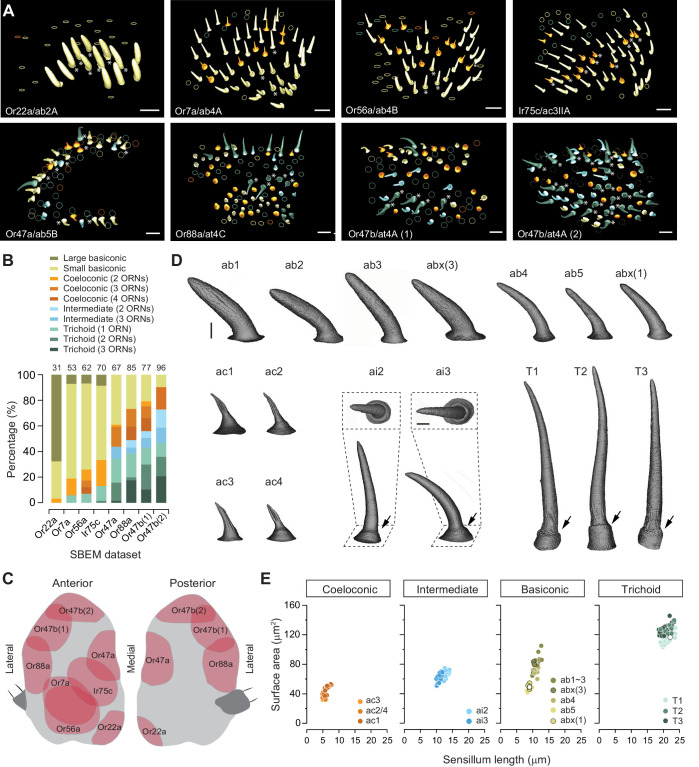
Figure 1. Different sensillum classes and their distribution across SBEM data sets.
(A) SBEM data sets analyzed in this study, named according to the genetically labeled ORNs (lower left corner, the receptor, and ORN identity are indicated). The 3D models of the cuticles are shown for basiconic (yellow), coeloconic (orange), intermediate (light blue), and trichoid sensilla (teal). Asterisks indicate the sensilla containing genetically labeled ORNs. Circles indicate partially sampled sensilla. The data sets are arranged approximately along the proximal-medial to distal-lateral axis on the anterior face of an antenna. Scale bars: 10 μm. (B) Percentage of different sensillum classes in individual data sets. The total numbers of sampled sensilla are indicated above the graph. (C) Illustration of antennal regions covered by individual SBEM data sets. (D) Isosurface images of identified sensillum types. Large basiconic: ab1, ab2, ab3, and abx(3); thin basiconic: ab4; and small basiconic: ab5 and abx(1). Coeloconic: ac1, ac2, ac3, and ac4. Intermediate: ai2 and ai3; insets: top-down perspective. Trichoid: T1, T2, and T3. Arrows indicate the basal drum. Scale bars: 2 μm. (E) Different sensillum classes exhibit distinctive morphometric features. The surface area for completely segmented sensillum cuticle is plotted as a function of sensillum length. Empty circles indicate the sensilla which do not house any ORNs. ORN, olfactory receptor neuron; SBEM, serial block-face scanning electron microscopy.

