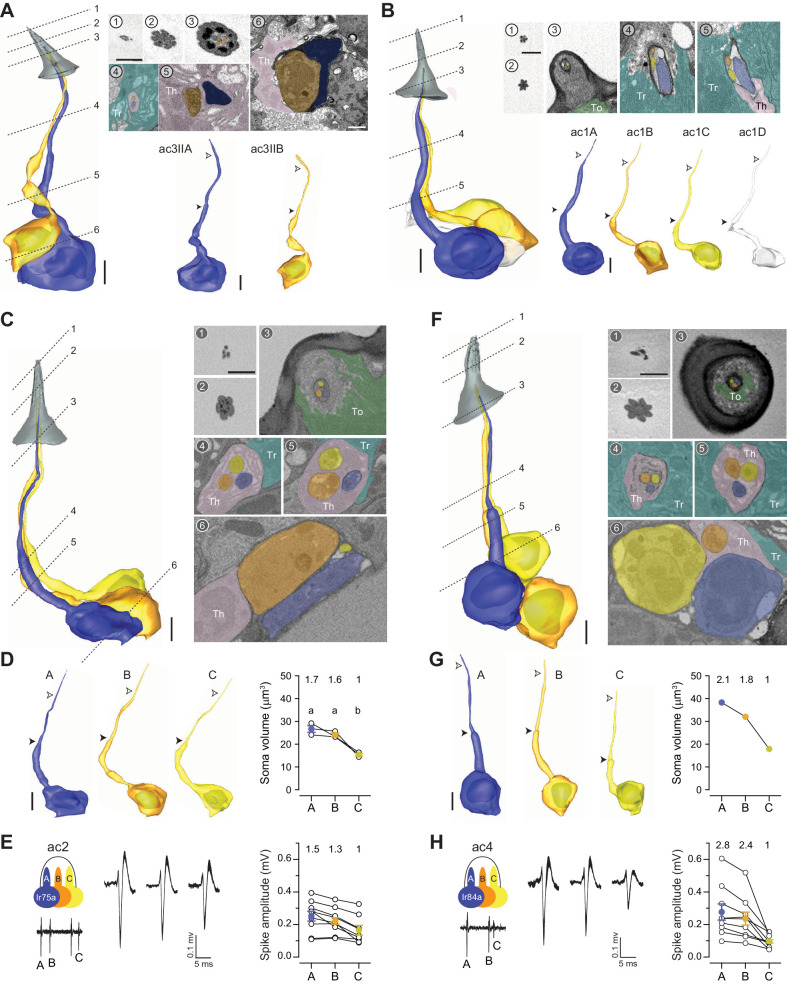
Figure 4. Coeloconic sensilla.
(A) 3D model and SBEM images of a representative ac3 sensillum. The ac3A ORNs were engineered to express APEX2 (Ir75c-GAL4>10XUAS-myc-APEX2-Orco) and labeled with DAB (darker staining). ORNs are pseudocolored to indicate neuronal identity: ac3A (blue) and ac3B (orange). Dashed lines indicate positions of the corresponding SBEM images. Filled arrow heads: ciliary constriction; empty arrow heads: sensillum base position. Th: thecogen; Tr: trichogen; and To: tormogen. (B) A representative ac1 sensillum. The four ORNs are pseudocolored based on their relative soma size in descending order: blue, orange, yellow, and white. (C) A representative ac2 sensillum. The three ORNs are pseudocolored based on their relative soma size in descending order: blue, orange, and yellow. (D) 3D models for individual ac2 neurons as shown in (C) and their respective soma volumes. Lines connect data points from neurons housed in the same sensillum, mean± s.e.m. n=3. The soma volume ratio is indicated above the graph. Significant differences (p<0.05) are indicated by different letters; paired t-test for comparison between neighboring neurons. (E) Extracellular spike amplitudes of grouped ac2 ORNs. Left: Average spike waveforms are shown for individual neurons. Line width indicates s.e.m. Right: Spike amplitude comparison. Each data point represents the average spike amplitude of an ORN based on its spontaneous activity. Lines connect data points from neighboring neurons. Colored dots denote average spike amplitudes, mean± s.e.m. n=9. Spike amplitude ratio is indicated above the graph. (F–H) As in (C–E), except that images are shown for an ac4 sensillum. Scale bars: 2 μm for 3D models and 1 μm for SBEM images. The scale bar in the first image panel also pertains to other images unless indicated otherwise. DAB, diaminobenzidine; ORN, olfactory receptor neuron; SBEM, serial block-face scanning electron microscopy.


