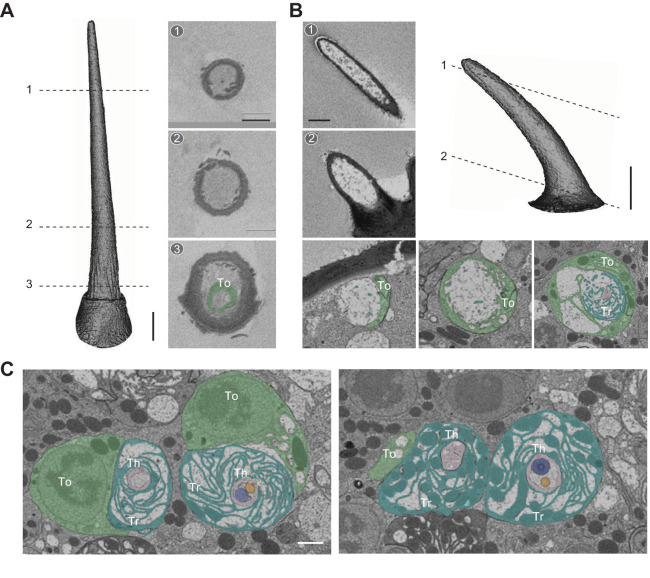
Figure 9. Empty sensillum.
Isosurface and SBEM images of an empty T1 (A) or an empty small basiconic sensillum (B). Dashed lines indicate positions of the corresponding SBEM images. (C) SBEM images showing the three auxiliary cells associated with the empty small basiconic as shown in (B) or with a neighboring small basiconic containing two neurons. ORNs are pseudocolored in blue (A neuron) or orange (B neuron). The left image is closer to the antennal surface than the right image. Th: thecogen; Tr: trichogen; and To: tormogen. Scale bars: 2 μm for isosurface models and 1 μm for SBEM images. The scale bar in the first image panel also pertains to other images unless indicated otherwise. ORN, olfactory receptor neuron; SBEM, serial block-face scanning electron microscopy.

