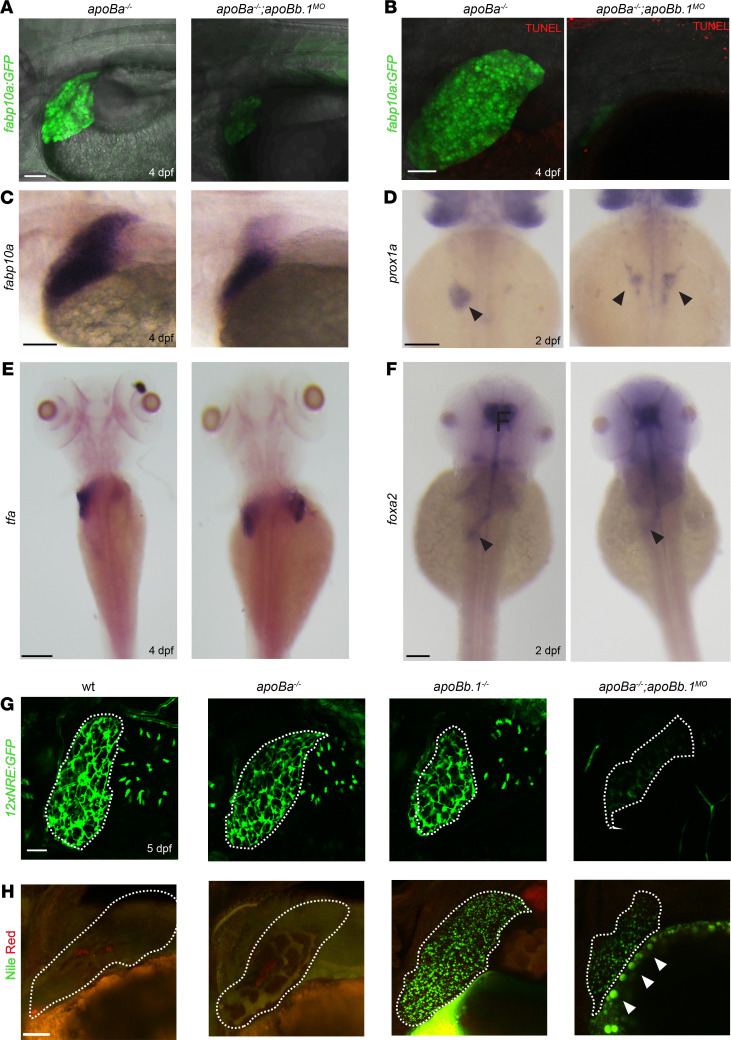
Figure 2. apoB mutants exhibit defective liver development and steatosis.
(A) Confocal images at 4 dpf of apoBa–/– and apoBa–/– apoBb.1MO embryos in Tg(-2.8fabp10a:EGFP)as3 background, showing smaller liver and decreased expression of fabp10a EGFP in apoBa–/– apoBb.1MO embryos (nWT = 8/8, napob–/– apoBa–/– apoBb.1MO = 7/7). (B) No apoptotic cells are detected in the liver of apoBa–/– or apoBa–/– apoBb.1MO embryos, following TUNEL staining (nWT = 6/6, napoBa–/– apoBb.1MO = 5/5). (C) WISH showing expression of fabp10a at 4 dpf, depicting decreased liver size in apoBa–/– apoBb.1MO embryos (nWT = 7, napoBa–/– apoBb.1MO = 13). (D and E) WISH with riboprobes against prox1a at 2 dpf (D) (nWT = 4/4, napoBa–/– apoBb.1MO = 7/9) and tfa at 4 dpf (E) (nWT = 7/7, napoBa–/– apoBb.1MO = 5/6) shows bilateral liver buds in apoBa–/– apoBb.1MO embryos as opposed to apoBa–/– mutants, which display a single liver bud located to the left of the midline. (F) Expression of forkhead box a2 (foxa2) at 2 dpf remains unchanged in apoBa–/– apoBb.1MO embryos as compared with apoBa–/– siblings. (G) Confocal images of 5 dpf Tg(12xNRE:Egfp) embryos with outlined livers, showing decreased Notch signal in the bile ducts of apoBa–/– apoBb.1MO embryos (nWT = 4, napoBa–/– = 8, napoBb1–/– = 6, napoBa–/– apoBb.1MO = 20). (H) Confocal images of Nile red staining at 4 dpf depicting neutral lipid accumulation in apoBb.1MO and apoBa–/– apoBb.1MO embryos. Red staining labels polar lipid; green fluorescence highlights neutral lipids (nWT = 5, napoBa–/– = 8, napoBb.1–/– = 5, napoBa–/– apoBb.1MO = 9). Scale bar: (A, B, G, and H) 50 μm, (C–F) 100 μm.

