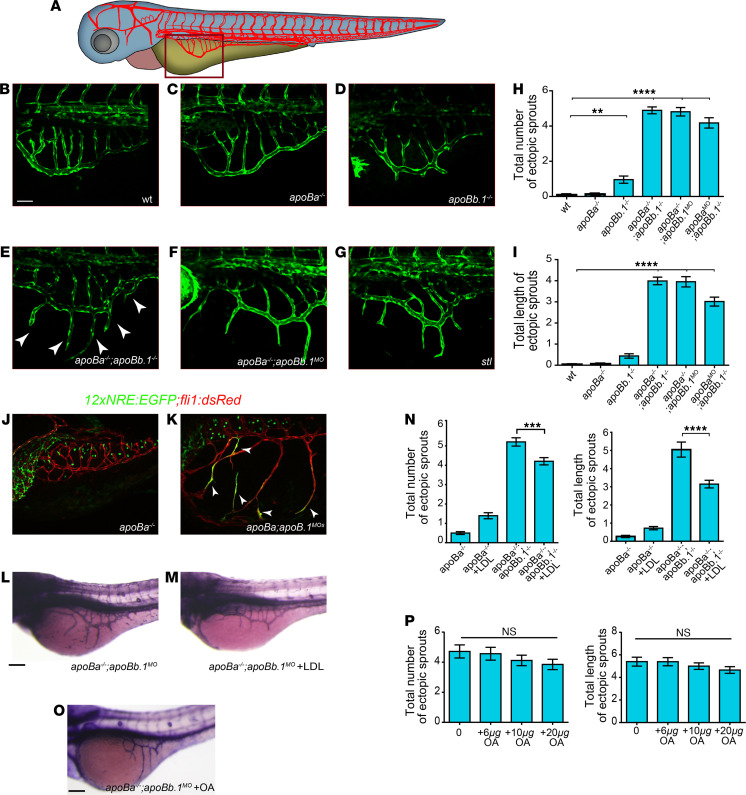
Figure 4. apoB mutants display hyperangiogenic phenotypes.
(A) Schematic representation of the zebrafish embryonic vasculature, with red square marking the subintestinal vessels (SIVs). (B–G) Confocal images at 3 dpf showing ectopic sprouts (arrowheads) arising in the SIVs of apoba–/– apoBb.1–/– double mutants (E), and apoba–/– apoBb.1MO (F) and stalactite (stl) mutants (G), but not in WT (B), apoBa–/– (C), or apoBb.1–/– (D) animals. (H and I) Quantification of the number (H) and length (I) of ectopic sprouts at 3 dpf. n = 3, nWT = 45, napoBa–/– = 55, napoBb.1–/– = 23, napoBa–/– apoBb.1–/– = 31, napoBa–/– apoBb.1MO = 40, napoBb.1–/– apoBaMO = 21. The data are shown as the mean ± SEM, calculated using ANOVA followed by Tukey’s multiple-comparison test. ****P < 0.0001, **P < 0.01. (J and K) Confocal images at 5 dpf of apoBa–/– and apoba–/– apoBb.1MO embryos in the Tg(12xNRE:Egfp) reporter background. White arrowheads in apoBa–/– apoBb.1MO embryos point to endothelial cells (ECs) with active Notch signaling, in ectopic sprouts that failed to retract. n = 2, napoBa–/– = 10, napoBa–/– apoBb.1MO = 12. (L and M) Alkaline phosphatase (AP) staining of the SIVs at 3 dpf, showing inhibition of ectopic sprouting following intravascular injection of DiI-LDL into apoBa–/– apoBb.1MO. (N) Quantification of number and length of ectopic sprouts following intravascular injection of DiI-LDL (n = 3, napoBa–/– = 57, napoBa–/–+LDL = 43, napoBa–/– apoBb.1MO = 67, napoBa–/– apoBb.1MO+LDL = 57). The data are shown as the mean ± SEM, calculated using ANOVA followed by Tukey’s multiple-comparison test. ****P < 0.0001, ***P < 0.001. (O) AP staining of the SIVs of 3 dpf apoBa–/– apoBb.1MO embryos treated with OA, as quantified (P) (n = 3, napoBa–/– apoBb.1MO = 20, napoBa–/– apoBb.1MO+6μgOA = 19, napoBa–/– apoBb.1MO+10μgOA = 21, napoBa–/– apoBb.1MO+20μg OA = 22). The data are shown as the mean ± SEM, calculated using ANOVA followed by Tukey’s multiple-comparison test. Scale bar: (B–G) 50 μm, (J–O) 100 μm. P < 0.05 (considered significant versus control group).

