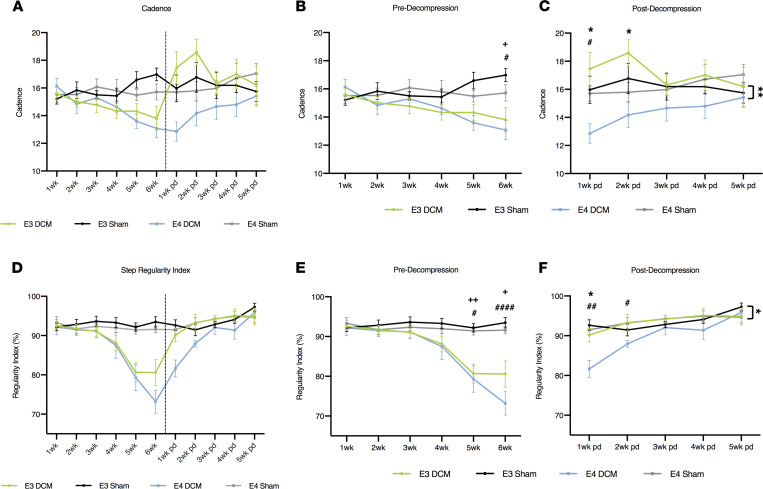
Figure 4. Results from gait analysis before and after decompression surgery show human ApoE4–knockin mice demonstrate a delayed recovery following decompression compared with human ApoE3–knockin mice.
(A) Overview of cadence for all experimental groups pre- and postdecompression. (B) Detailed cadence predecompression. +P < 0.05, #P < 0.05. Comparisons were made between E3-DCM and E3-Sham (indicated with + to show significance), E4-DCM and E4-Sham (indicated with # to show significance), and E3-DCM and E4-DCM (indicated with * to show significance). (C) Detailed cadence postdecompression. #P < 0.05. *P < 0.05, **P < 0.01. (D) Overview of step regularity index for all experimental groups pre- and postdecompression. (E) Detailed regularity index predecompression. +P < 0.05, ++P < 0.01, #P < 0.05, ####P < 0.0001. (F) Detailed regularity index postdecompression. #P < 0.05, ##P < 0.01, *P < 0.05. All data are represented as mean ± SEM and were analyzed using a mixed effects model with Sidak’s post hoc correction for repeated measures. Dashed vertical line in graphs (A and D) represent the decompression time point. Wk, week; pd, postdecompression.

