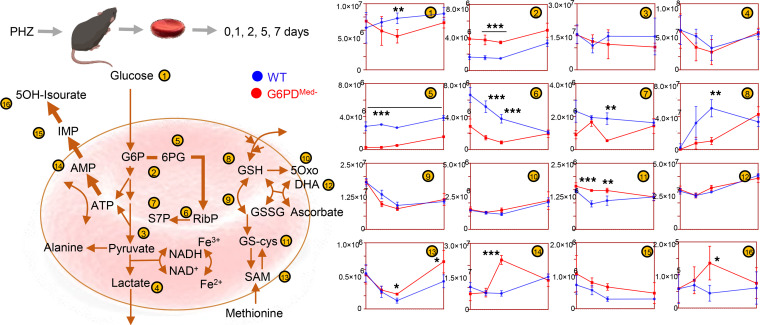
Figure 5. Metabolic impact of PHZ treatment in vivo on WT and G6PD-deficient mouse RBCs.
Overview of glycolysis, PPP, glutathione metabolism and recycling, and purine oxidation in RBCs from WT (blue) and G6PDMed- (red) mice (n = 3) treated with 1 mM PHZ for up to 7 days. Time points tested were 0 (no PHZ), 1, 2, 5, and 7 days from treatment with PHZ. Line plots indicate median ± range per each time point. Y axes indicate metabolite abundance in arbitrary units. *P < 0.05, **P < 0.01, ***P < 0.001.

