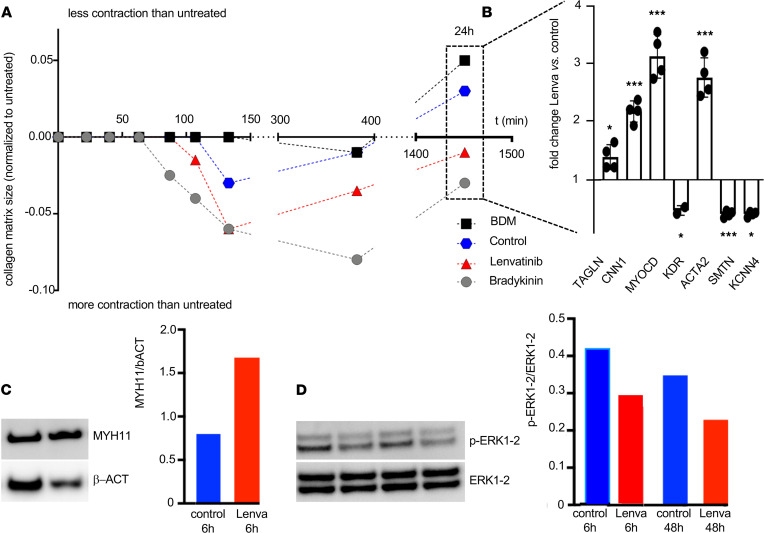
Figure 4. Lenvatinib triggers SMC contractility in vitro.
(A) Collagen-based contractility assay to assess AAA patient-derived SMCs’ contraction in presence of vasoactive hormone bradykinin (gray), contraction inhibitor BDM (black), lenvatinib (red), and control treatment DMSO (blue). (B) Gene expression analysis performed on cells embedded in the collagen matrix after 24 hours showing the lenvatinib treatment effect in comparison to the control-exposed cells. (Data are presented as mean + SEM; *P < 0.05, ***P < 0.001.) (C) Western blot analysis for MYH11 and (D) phosphorylated ERK1-2 in control treated (blue) and lenvatinib-treated cells (red). Protein bands were quantified and normalized to β-actin and total ERK1-2, respectively. Complete Western blot (WB) images are shown in Supplemental Figure 9A and Supplemental Figure 10A.

