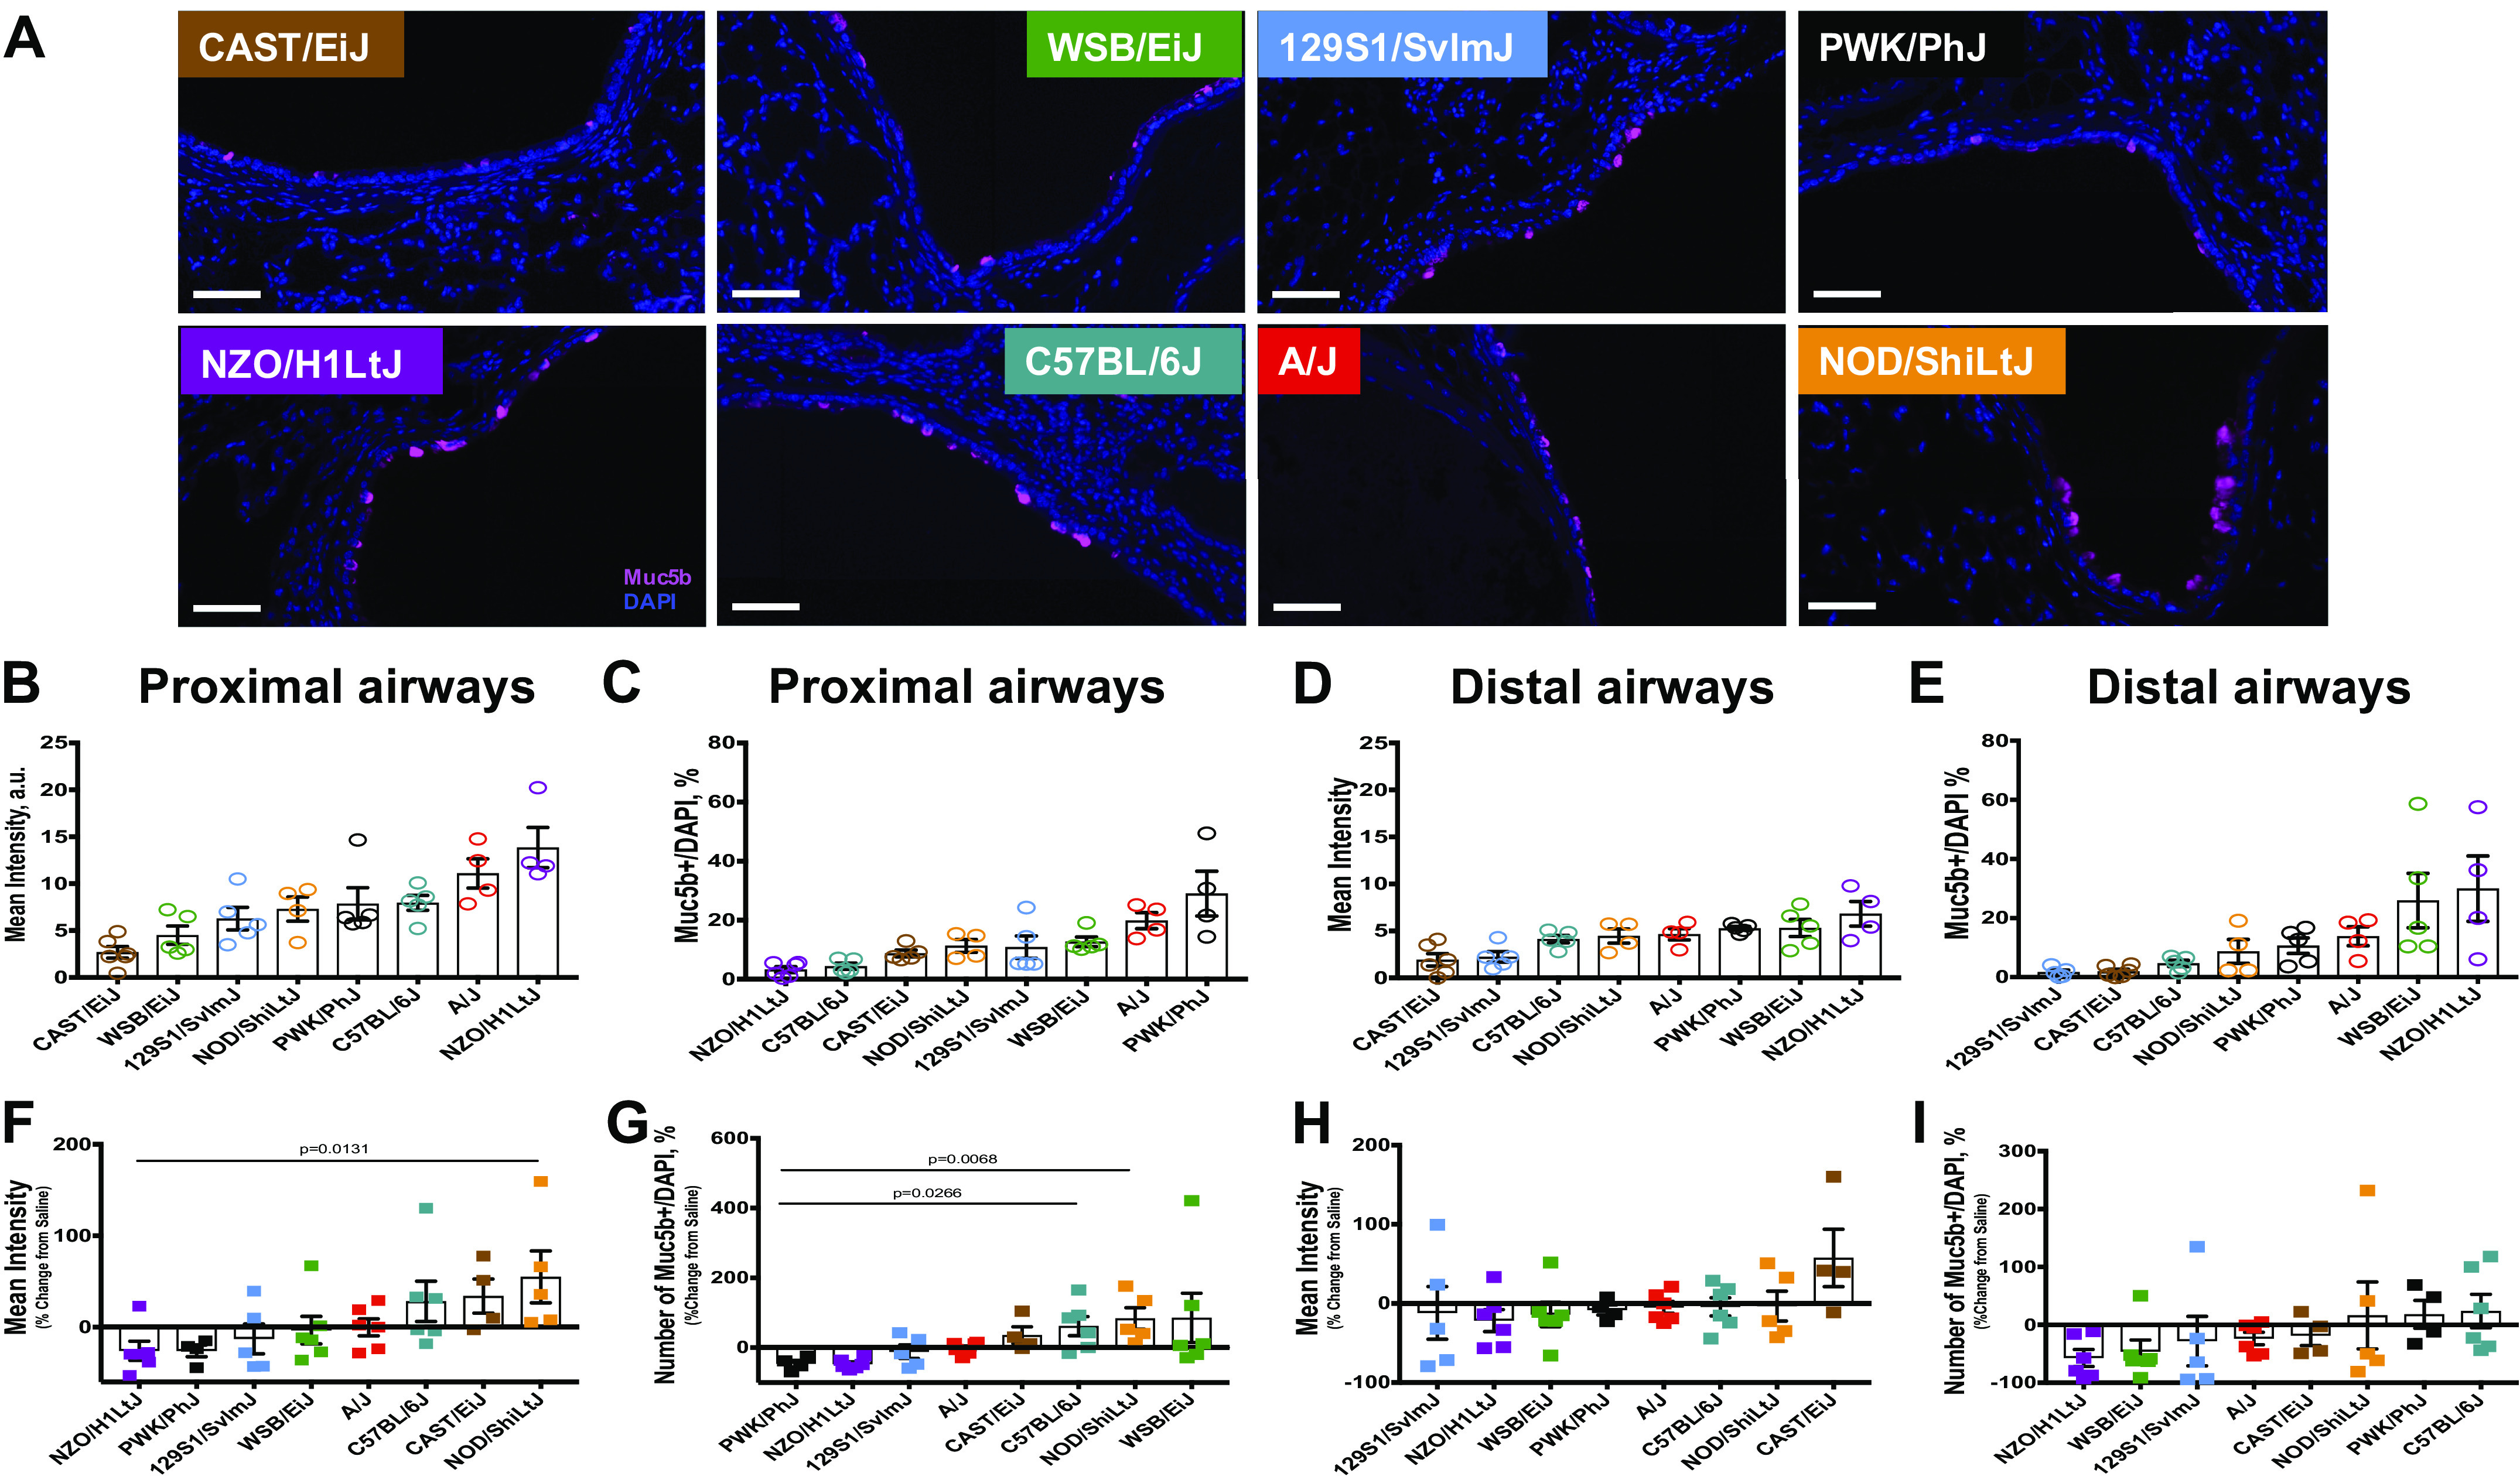
Figure 5.

Airways Muc5b expression. A: representative images for Muc5b (purple) staining in the proximal airways for 8 strains of mice. Tissues were counterstained with nuclear staining (DAPI, blue). Bar, 100 µm. Quantification for Muc5b mean intensity in proximal (B and F, Supplemental Fig. S6, top row) and distal (C and G, Supplemental Fig. S7, top row) airways, and number of Muc5b expressing cells in proximal (D and H, Supplemental Fig. S6, bottom row) and distal (E and I, Supplemental Fig. S7, bottom row) airways. n = 4–5 mice were analyzed after bleomycin-induced injury and compared with n = 4–5 saline treated-control mice from each strain.
