Figure 2.
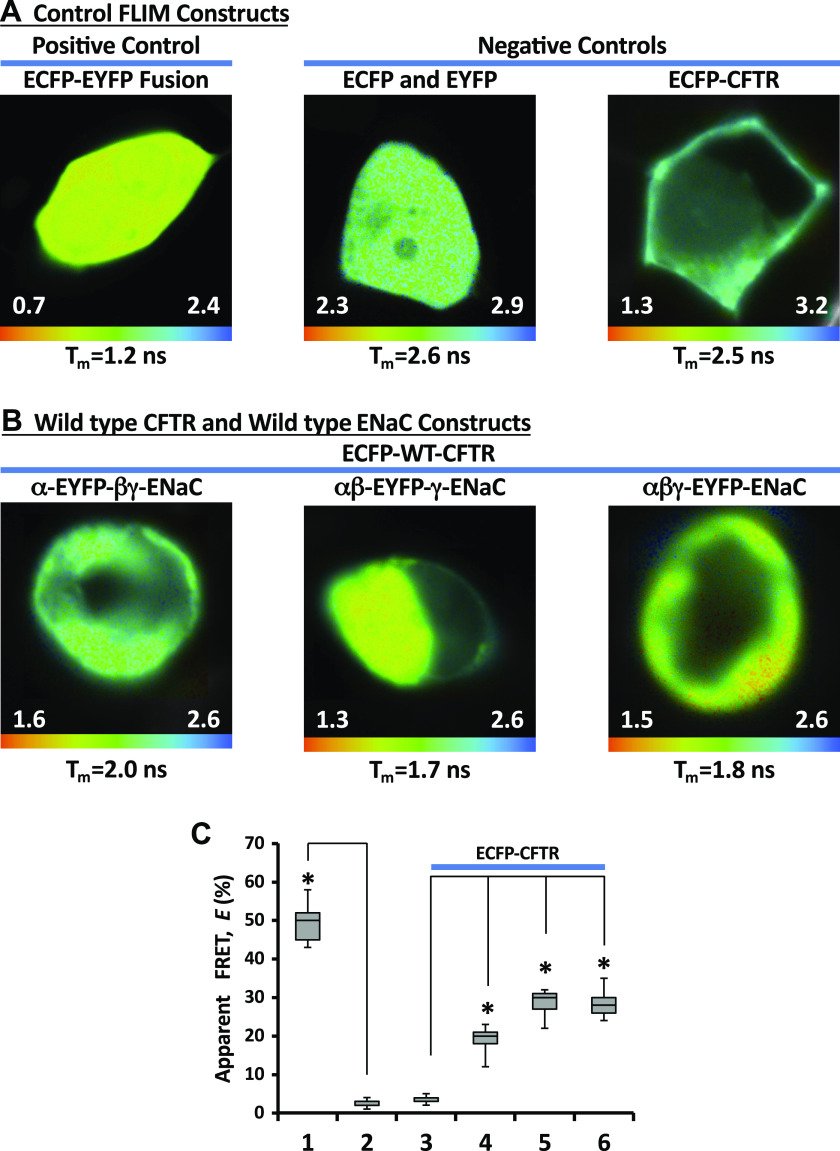
Fluorescence resonance energy transfer (FRET) measurement by fluorescence lifetime imaging microscopy. Enhanced cyan fluorescent protein (ECFP)-enhanced yellow fluorescent protein (EYFP) fusion protein separated by a 7 amino acid linker served as a positive control (A, left) while separately coexpressed ECFP and EYFP, or ECFP-CFTR expressed alone served as a negative control (A, right). The images in B are shown for the cells transfected with wild type (WT)-ECFP-cystic fibrosis transmembrane conductance regulator (CFTR) and WT αβγ-epithelial sodium channel (ENaC) (in αβγ-ENaC one of the three subunits were tagged at the C-terminus with EYFP). The images were taken with Becker and Hickl FLIM system attached to Zeiss confocal microscope. The lifetime images are shown in pseudocolors (nanoseconds). The apparent mean lifetime for each image is shown at the bottom of each image. Note: each image has separate lifetime range (ns). C: apparent FRET efficiencies, E, obtained with fluorescence lifetime imaging microscopy (FLIM) in the cells cotransfected with vectors encoding ECFP-CFTR and αβγ-ENaC. One subunit in ENaC complex was tagged with EYFP: α-EYFP (4), β-EYFP (5), and γ-EYFP (6). ECFP-EYFP fusion construct (1) served as a positive control while separately coexpressed ECFP and EYFP (2), and ECFP-CFTR expressed alone served as a negative controls. *Statistically significant changes compared with negative controls (2 or 3) and was calculated using the Student’s t test. These experiments were repeated at least five times with similar results.

