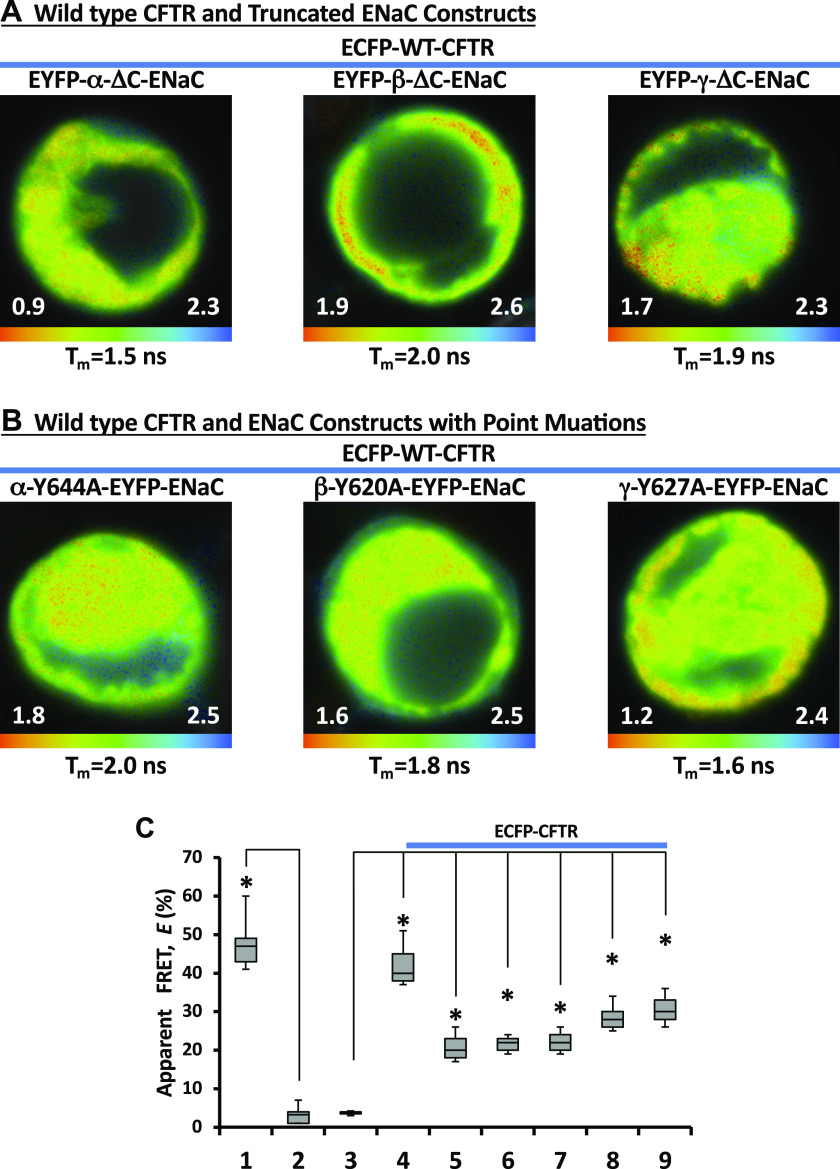
Figure 3.
Fluorescence lifetime imaging microscopy (FLIM) images of the cells cotransfected with enhanced cyan fluorescent protein (ECFP)-cystic fibrosis transmembrane conductance regulator (CFTR) and epithelial sodium channel (ENaC) subunits with C-terminal mutations. The cells were cotransfected with ECFP-CFTR and αβγ-ENaC. One subunit in αβγ-ENaC complex was truncated at the C-terminus and N-terminally tagged with enhanced yellow fluorescent protein (EYFP) (A) or mutated at the C-terminus and C-terminally tagged with EYFP (B). The lifetime images are shown in pseudocolors (nanoseconds). The apparent mean lifetime for each image is shown at the bottom of each image. Note: each image has separate lifetime range (ns). C: apparent fluorescence resonance energy transfer (FRET) efficiencies, E, in the cells cotransfected with ECFP-CFTR and αβγ-ENaC. One subunit in αβγ-ENaC complex was truncated at the C-terminus and N-terminally tagged with EYFP: EYFP-α-ΔC (4), EYFP-β-ΔC (5), or EYFP-γ-ΔC (6). The ENaC subunit with a point at the C-terminus was C-terminally tagged with EYFP: α-Y644A-EYFP (7), β-Y620A-EYFP (8), or γ-Y627A-EYFP (9). ECFP-EYFP fusion (1) served as a positive control while separately coexpressed ECFP and EYFP (2), and ECFP-CFTR expressed alone served as a negative controls. *Statistically significant changes compared with negative controls (2 or 3) and was calculated using the Student’s t test. These experiments were repeated at least five times with similar results.

