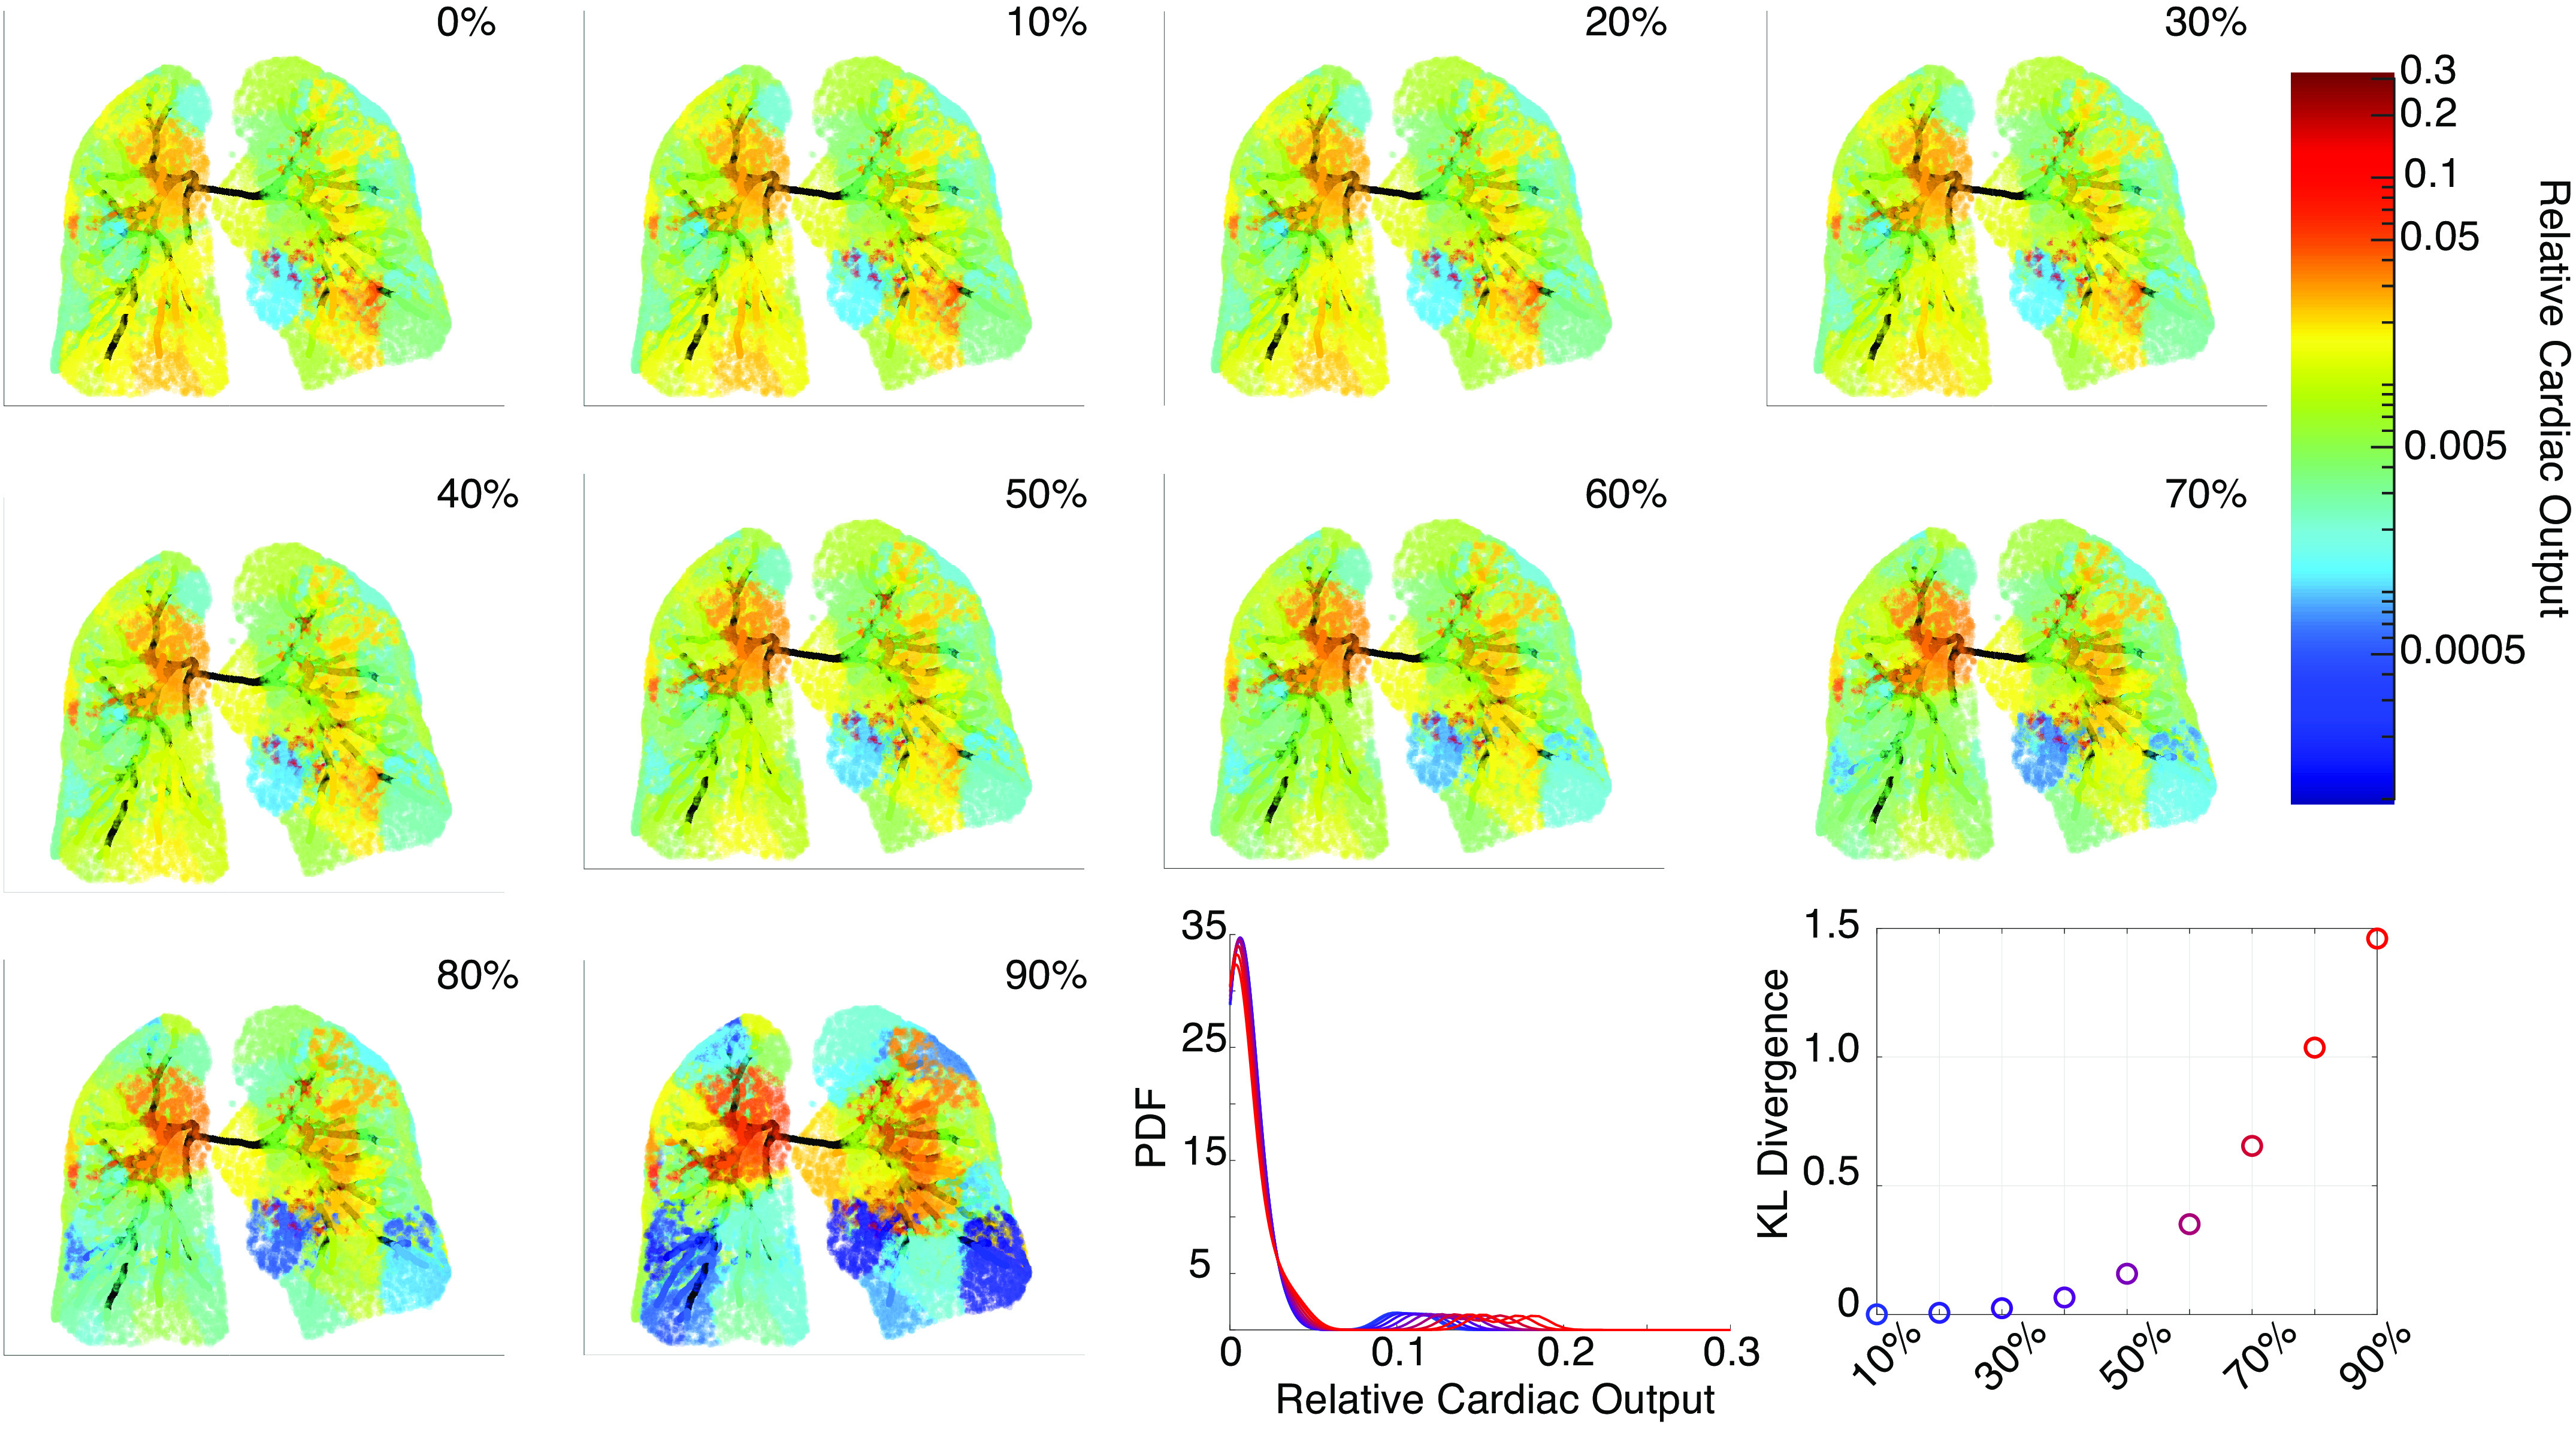
Figure 3.

Perfusion maps for increasing ring-like stenosis severity. The top left (0%) shows the normotensive perfusion map, while the bottom right perfusion map shows 90% severity. The Kullback–Leibler (KL) divergence, constructed from the flow probability density function (PDF), quantifies the flow heterogeneity. PDFs are constructed using kernel density estimation with a bandwidth of and a reflection boundary correction.
