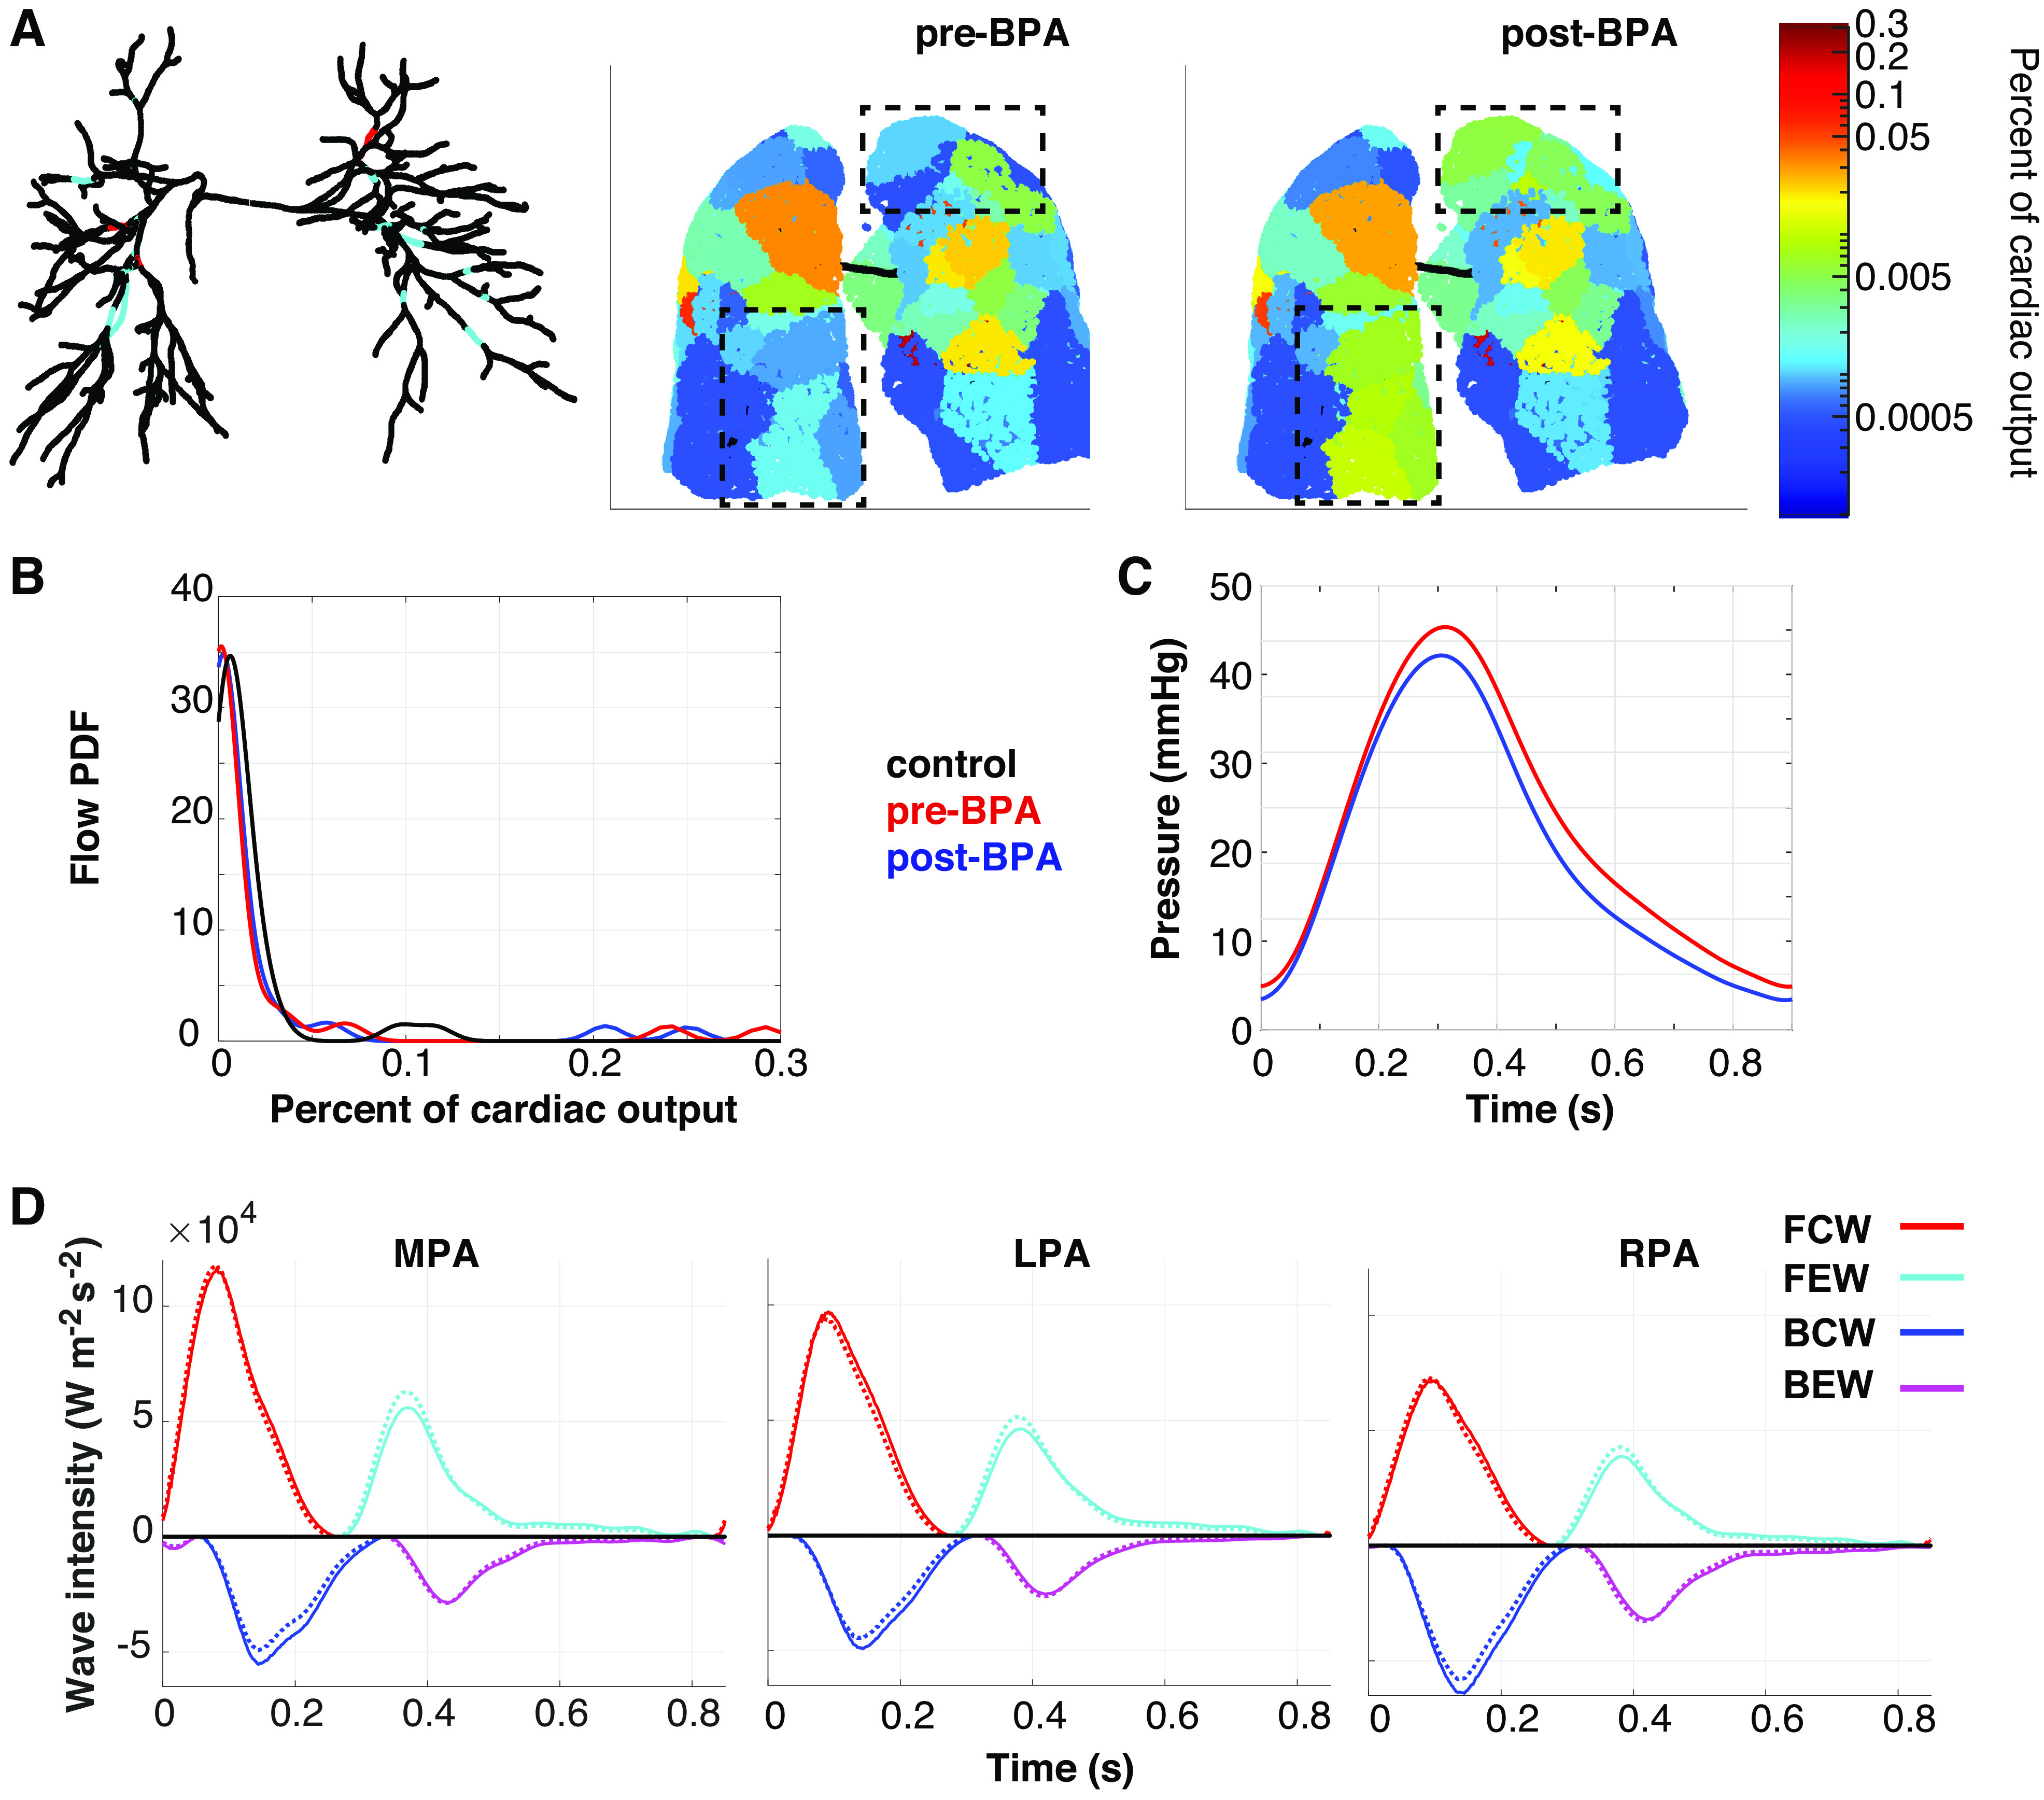
Figure 9.

Pre- and post-balloon pulmonary angioplasty (BPA) metrics used to select the most effective treatment strategies. A total of 1,140 interventions are considered. A: network of vessels with untreated lesions (cyan) and lesions treated in the best BPA simulation (red) along with pre- and post-BPA perfusion maps. The region of the tissue most affected by BPA is identified within the black, dash-dot boxes. B: flow probability distribution functions (PDFs) for the normotensive (black), pre-BPA (red), and post-BPA (blue). C: pressure in the main pulmonary artery (MPA) pre-BPA (red) and post-BPA (black). D: wave intensities in the MPA, left pulmonary artery (LPA), and right pulmonary artery (RPA), pre-BPA (solid line) and post-BPA (dotted line).
