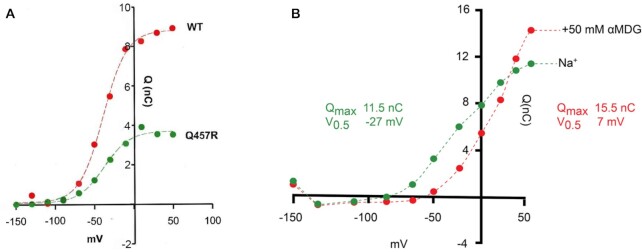
Figure 8.
A. Charge-voltage (Q/V) relationships for WT and Q457R SGLT1. A. Charge was obtained by integration of SGLT1 current transients in the absence of sugar (see methods). The symbols correspond to the experimental data after the subtraction of the NI oocyte values, and normalized to WT charge at + 50 mV. The dotted lines are drawn according to the Boltzmann relation. Mutant Qmax (maximal charge transfer) was 40% of the WT value (3.7 ± 0.2 vs. 8.8 ± 0.3 nC). The V0.5 values were −47 and −50 mV, and z 1.4. B. Q/V relationships of Q457R SGLT1 in the absence and in the presence of the 50 mM αMDG. Q was obtained by the integration of current transients in the absence and in the presence of 50 mM αMDG. The symbols correspond to the experimental data and the curves are drawn according to the Boltzmann relation. The addition of 50 mM αMDG induced an increase of Qmax, from 11.5 to 15.5 nC, and a shift of V0.5 from −27 to + 7 mV, but no change in z (1.1).

