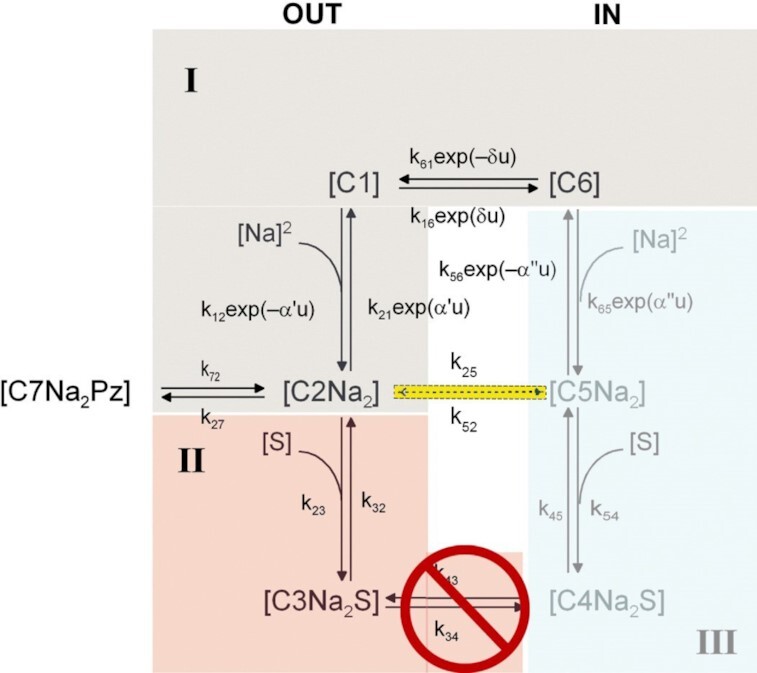
Figure 9.

Six-state kinetic model of Na+/glucose uptake by SGLT1 expressed in oocytes. The external Na+ concentration was 100 m-equiv/l and external glucose concentration was 0–100 mM. As indicated in light blue the internal Na+ was 5 m-equiv/l and the cytoplasm was sugar-free. For simulations, the rate constants are: WT hSGLT1: k12 = 14000 M –2s–1, k21 = 300 s–1, k16 = 600 s–1, k61 = 25 s–1, k23 = 45000 M –1s–1, k32 = 20 s–1, k34 = 50 s–1, k43 = 50 s–1, k45 = 800 s–1, k54 = 7800 M–1s–1, k65 = 4500 M–2s–1, k56 = 10 s–1, and k25 = 0.3 s–1. k54 = 7800 M–1s–1 and k52 = 0.001 s–1 were determined by microscopic reversibility.15 The rate constants of mutant Q457R that accounted for its kinetics were the same as WT, except for k23 = 800 M–2s–1, k25 = 50 s–1, k34 = 0 s–1, and k43 = 0 s–1. Again, k54 = 140 M–1s–1 and k52 = 0.2 s–1 were determined by microscopic reversibility. u = FV/RT, α' = 0.3, δ = 0.7. α" = 0.
