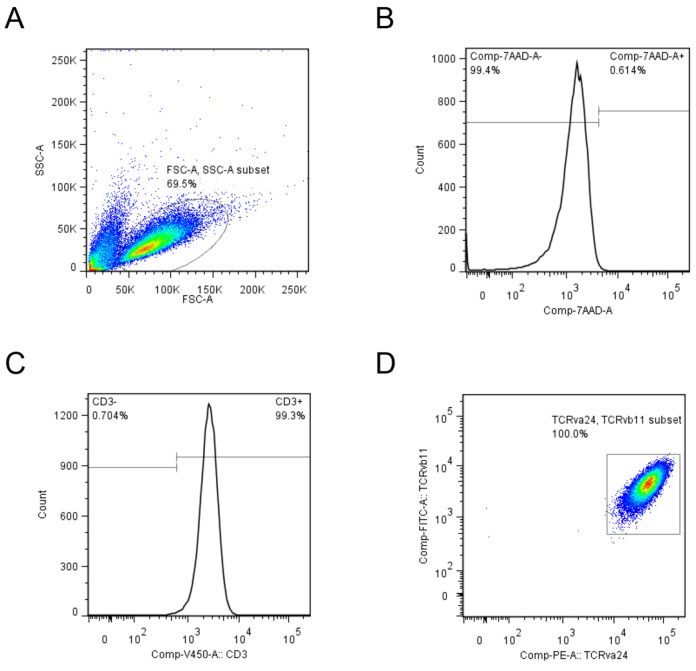
Figure 6. Representative iPS-NKT cells analysis using flow cytometer.
A. Lymphocyte fraction was gated using FSC and SSC as indicated by ellipse. B. Live cells were selected by 7-AAD negative fraction. C. CD3 positive fraction was selected and D. TRAV24 and TRBV11 positive cells were indicated as square.

