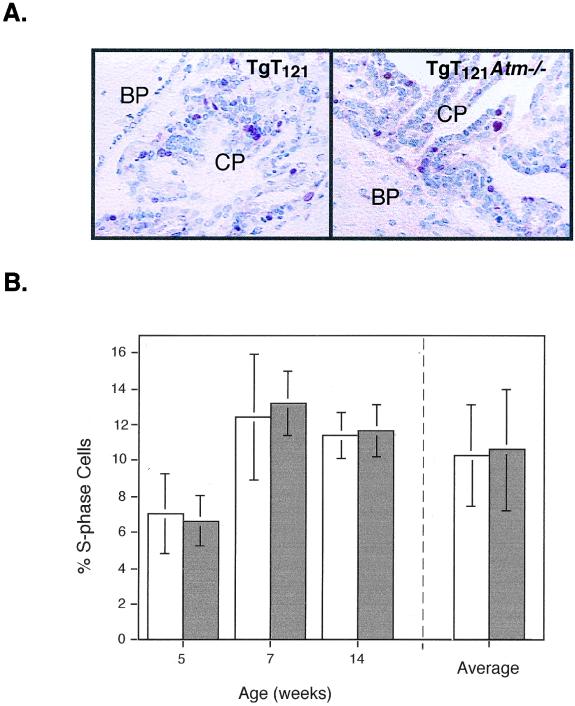
FIG. 4.
Effects of Atm deficiency on tumor cell proliferation. TgT121 and TgT121 Atm−/− CP were stained for BrdU incorporation to measure proliferation rates. (A) Representative views of CP from TgT121 and TgT121 Atm−/− 7-week-old littermates stained for BrdU (red), with nuclei counterstained by hematoxylin (blue). No BrdU-staining cells are present in the surrounding brain parenchyma (BP). (B) Percentage of S-phase cells in TgT121 (open bars) and TgT121 Atm−/− (solid bars) CP. Left, percentage of proliferating cells in paired littermates (each bar represents brain sections from one mouse; error bars represent the standard deviations among sets of 10 microscopic fields); right, averaged percentage of S-phase cells in these age-matched groups shown at the left (error bars represent standard deviations among individual mice).

